 Global| Jun 09 2006
Import Prices Jumped; Excl. Oil Strength in Industrial Materials
by:Tom Moeller
|in:Economy in Brief
Summary
Total import prices advanced another 1.6% last month after a 2.1% jump during April. Again, the rise easily surpassed Consensus expectations which had been for a 0.7% increase. Import prices less petroleum jumped 0.6%, the strongest [...]
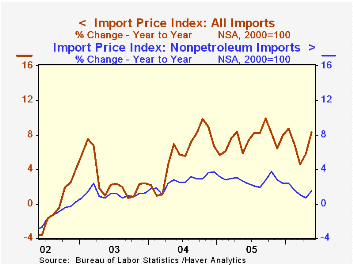
Total import prices advanced another 1.6% last month after a 2.1% jump during April. Again, the rise easily surpassed Consensus expectations which had been for a 0.7% increase.
Import prices less petroleum jumped 0.6%, the strongest monthly gain since October. That strength was led by higher prices for nonoil industrial materials which surged 2.5% (9.0% y/y) reflecting firm prices for paper (5.9% y/y), nonferrous metals (49.7% y/y) and chemicals (5.5% y/y).
Capital goods prices were unchanged as they have been all year (-1.6% y/y) and excluding computers, capital goods prices rose just 0.1% (0.6% y/y). Prices for nonauto consumer goods rose 0.3% (-0.1% y/y) following two months of decline. 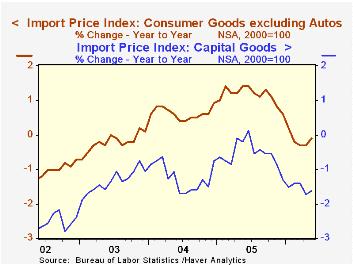
During the last ten years there has been a 66% (negative) correlation between the nominal trade-weighted exchange value of the US dollar vs. major currencies and the y/y change in non oil import prices. The correlation is a lower 47% against a broader basket of currencies and a lower 57% against the real value of the dollar.
Petroleum prices posted a 5.2% increase but recent declines in crude oil prices suggest moderation.
Export prices were firm again and rose 0.7%. Pricing strength has been broad based for industrial supplies (10.9% y/y) but foods & beverages are down 1.2% (y/y), capital goods prices are just 0.2% higher y/y while nonauto consumer goods exports prices are up 1.0% y/y.
| Import/Export Prices (NSA) | May | April | Y/Y | 2005 | 2004 | 2003 |
|---|---|---|---|---|---|---|
| Import - All Commodities | 1.6% | 2.1% | 8.3% | 7.5% | 5.6% | 2.9% |
| Petroleum | 5.2% | 11.5% | 45.7% | 37.6% | 30.5% | 21.0% |
| Non-petroleum | 0.6% | 0.1% | 1.5% | 2.7% | 2.6% | 1.1% |
| Export - All Commodities | 0.7% | 0.6% | 3.4% | 3.2% | 3.9% | 1.6% |

Tom Moeller
AuthorMore in Author Profile »Prior to joining Haver Analytics in 2000, Mr. Moeller worked as the Economist at Chancellor Capital Management from 1985 to 1999. There, he developed comprehensive economic forecasts and interpreted economic data for equity and fixed income portfolio managers. Also at Chancellor, Mr. Moeller worked as an equity analyst and was responsible for researching and rating companies in the economically sensitive automobile and housing industries for investment in Chancellor’s equity portfolio. Prior to joining Chancellor, Mr. Moeller was an Economist at Citibank from 1979 to 1984. He also analyzed pricing behavior in the metals industry for the Council on Wage and Price Stability in Washington, D.C. In 1999, Mr. Moeller received the award for most accurate forecast from the Forecasters' Club of New York. From 1990 to 1992 he was President of the New York Association for Business Economists. Mr. Moeller earned an M.B.A. in Finance from Fordham University, where he graduated in 1987. He holds a Bachelor of Arts in Economics from George Washington University.
More Economy in Brief


