 Global| Jul 29 2008
IFO Detail Shows Spreading Weakness
Summary
The IFO is showing more weakness in Germany. Today’s report provides more detail from its earlier release. The current situation index is still strong residing in the 70th percentile since March of 1992. But expectations are down to [...]
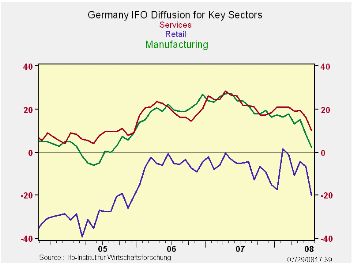
The IFO is showing more weakness in Germany. Today’s report
provides more detail from its earlier release. The current situation
index is still strong residing in the 70th percentile since March of
1992. But expectations are down to the 29th percentile of their range
for that period. Business expectations for the next six months are in
their 33rd percentile for overall MFG. The consumer goods MFG
sub-sector lags the most standing only in the 19th percentile of its
range. The sectors construction, wholesaling and retailing stand in the
45th, 39th and 30th percentiles of their respective ranges. All are
below their respective range midpoints. Only construction is still
above its period average.
The IFO finds that current activity is doing better for MFG
activity at a reading in the 51st percentile of its historic range.
Even so the MFG index is below its historic average. MFG demand is
gauged as weak and is in the 37th percentile of its range. Orders on
hand are in the 38th percentile of their range but foreign orders are
much stronger, in the 81st percentile of their range. Domestic weakness
in orders is being offset by strength from abroad despite the overly
strong euro.
| IFO Survey: Germany | ||||||||
|---|---|---|---|---|---|---|---|---|
| Percent: Yr/Yr | Index Numbers | |||||||
| Jul 08 |
Jun 08 |
May 08 |
Apr 08 |
Mar 08 |
Current | Average | %-ile | |
| Biz Climate | -8.5% | -5.4% | -4.6% | -5.8% | -2.7% | 97.5 | 96.0 | 52.7% |
| Current Situation | -5.1% | -2.7% | -2.1% | -4.2% | -0.7% | 105.7 | 95.5 | 70.0% |
| Biz Expectations | -11.7% | -8.0% | -7.1% | -7.2% | -4.7% | 90.0 | 96.7 | 29.7% |
| average & range since Apr-92 | ||||||||
| Jul08 | Jun 08 |
May 08 |
Apr 08 |
Mar 08 |
Current | Average | %-ile | |
| Biz Climate | -8.5% | -5.4% | -4.6% | -5.8% | -2.7% | 97.5 | 96.0 | 52.7% |
| Current Situation | -5.1% | -2.7% | -2.1% | -4.2% | -0.7% | 105.7 | 95.5 | 70.0% |
| MFG | -5.6% | -4.6% | -2.5% | -3.7% | -1.2% | 105.2 | 93.2 | 80.0% |
| Intermediate goods | -7.0% | -6.6% | -6.9% | -6.9% | -3.7% | 104.2 | 91.8 | 75.9% |
| Capital goods | -3.7% | -2.8% | 2.1% | 1.6% | 1.6% | 108.0 | 93.1 | 85.2% |
| Consumer goods | -6.4% | -4.1% | -1.4% | -4.1% | -0.5% | 101.9 | 96.3 | 65.7% |
| Construction | -2.4% | 0.6% | -1.1% | -2.7% | -4.0% | 111.9 | 103.4 | 63.3% |
| Wholesale | -5.1% | -3.7% | -3.6% | -5.4% | 0.0% | 111.0 | 100.1 | 60.4% |
| Retail | -5.8% | 4.8% | 0.6% | -6.7% | 3.7% | 97.8 | 95.7 | 61.0% |
| Next 6 Mos | ||||||||
| Biz Expectations | Jul 08 |
Jun 08 |
May 08 |
Apr 08 |
Mar 08 |
Current | Average | %-ile |
| MFG | -13.7% | -9.5% | -8.3% | -8.3% | -5.6% | 87.2 | 96.4 | 33.6% |
| Intermediate | -12.0% | -9.1% | -9.2% | -7.0% | -6.6% | 87.2 | 95.8 | 28.2% |
| Capital | -17.7% | -9.0% | -8.4% | -8.7% | -5.1% | 84.7 | 96.3 | 36.5% |
| Consumer | -11.0% | -11.1% | -6.4% | -9.6% | -6.0% | 91.2 | 97.8 | 19.4% |
| Construction | -6.4% | -3.6% | -4.9% | -3.7% | -5.0% | 98.5 | 98.4 | 45.2% |
| Wholesale | -9.8% | -7.4% | -9.2% | -8.9% | -6.1% | 94.7 | 97.2 | 39.3% |
| Retail | -10.1% | -6.0% | -1.5% | -3.9% | 1.5% | 89.6 | 96.1 | 30.5% |
| (m/m) | ||||||||
| Activity(m/m) | Jul 08 |
Jun 08 |
May 08 |
Apr 08 |
Mar 08 |
Current | Average | %-ile |
| MFG | -6.2% | -5.3% | 0.5% | -6.1% | -1.9% | 96.6 | 97.1 | 51.7% |
| Intermediate | -5.0% | -4.8% | -1.9% | -6.6% | -3.8% | 96.0 | 96.4 | 51.8% |
| Capital | -5.7% | -7.0% | 2.9% | -4.2% | 0.4% | 98.4 | 97.3 | 61.4% |
| Consumer | -5.9% | -4.5% | 0.0% | -9.0% | -1.4% | 97.5 | 98.5 | 42.5% |
| Demand M/M | Jul 08 |
Jun 08 |
May 08 |
Apr 08 |
Mar 08 |
Current | Average | %-ile |
| MFG | -9.1% | -9.9% | -2.4% | -11.3% | -4.1% | 92.1 | 97.1 | 37.1% |
| Intermediate | -6.2% | -7.7% | 0.5% | -10.6% | -4.7% | 94.7 | 97.5 | 42.4% |
| Capital | -13.7% | -13.3% | -3.3% | -13.8% | -5.0% | 86.6 | 95.9 | 36.8% |
| Consumer | -9.9% | -10.8% | -3.2% | -7.6% | 0.5% | 94.2 | 96.6 | 37.5% |
| Orders on hand | Jul 08 |
Jun 08 |
May 08 |
Apr 08 |
Mar 08 |
Current | Average | %-ile |
| MFG | -11.0% | -9.8% | -4.7% | -8.8% | -1.0% | 92.7 | 96.5 | 38.8% |
| Intermediate | -8.3% | -7.6% | -1.5% | -9.8% | -3.4% | 94.5 | 96.6 | 42.9% |
| Capital | -16.7% | -14.7% | -9.1% | -10.1% | 0.5% | 88.1 | 95.8 | 37.7% |
| Consumer | -5.4% | -5.4% | -1.5% | -7.2% | 0.5% | 98.4 | 98.6 | 41.3% |
| Foreign orders on hand | Jul 08 |
Jun 08 |
May 08 |
Apr 08 |
Mar 08 |
Current | Average | %-ile |
| MFG | -5.3% | -4.8% | -2.9% | -2.0% | -1.0% | 105.7 | 95.3 | 81.0% |
| Intermediate | -5.4% | -5.9% | -3.9% | -3.9% | -2.9% | 103.3 | 94.3 | 72.9% |
| Capital | -5.4% | -5.9% | -3.2% | 0.9% | 1.4% | 107.9 | 94.4 | 83.9% |
| Consumer | -3.6% | -1.5% | 0.0% | -4.5% | -3.6% | 107.2 | 99.0 | 74.1% |
| Yr/Yr percentage changes in underlying Indices | ||||||||
| IFO outlook for 3-Months ahead | ||||||||
| 3-Mos ahead | ||||||||
| Expected Activity | Jul 08 |
Jun 08 |
May 08 |
Apr 08 |
Mar 08 |
Current | Average | %-ile |
| MFG | -8.0% | -6.5% | -2.8% | -3.2% | -1.9% | 94.9 | 96.9 | 54.2% |
| Intermediate goods | -7.0% | -8.4% | -3.2% | -4.9% | -2.8% | 95.5 | 96.4 | 52.8% |
| Capital goods | -9.4% | -7.0% | -2.2% | -0.9% | -2.8% | 93.5 | 96.7 | 52.7% |
| Consumer goods | -7.0% | -4.2% | -3.8% | -3.7% | -1.3% | 96.6 | 98.3 | 38.0% |
| Orders expectations | Changes over 12-months | |||||||
| Retail Orders Expectations | -13.0% | 1.0% | -4.0% | 2.1% | 6.0% | -24.1 | -17.3 | 44.7% |
| Wholesale | -17.0% | -6.0% | -11.0% | -16.9% | -6.0% | -9.6 | -13.2 | 50.9% |
| EXPORT Biz Expectations | ||||||||
| MFG | -4.3% | -4.7% | -3.8% | -1.8% | -1.5% | 99.2 | 98.6 | 67.0% |
| Intermediate goods | -5.8% | -6.7% | -5.2% | -2.3% | -1.9% | 98.5 | 99.0 | 55.9% |
| Capital goods | -3.3% | -2.9% | -3.7% | 1.0% | -1.9% | 99.2 | 97.8 | 73.9% |
| Consumer goods | -3.8% | -2.4% | -1.0% | -5.2% | -2.4% | 100.1 | 99.2 | 55.6% |
| Employment Expectations | ||||||||
| MFG | -6.2% | -4.7% | -1.5% | -0.5% | -1.6% | 99.9 | 96.4 | 61.6% |
| Intermediate goods | -3.7% | -4.2% | -1.6% | 0.0% | -0.6% | 101.4 | 96.4 | 73.8% |
| Capital goods | -9.6% | -6.6% | -1.0% | -0.5% | -2.5% | 97.6 | 95.5 | 52.7% |
| Consumer goods | -3.0% | -3.1% | 1.0% | -1.5% | -3.1% | 101.3 | 95.1 | 79.6% |

Robert Brusca
AuthorMore in Author Profile »Robert A. Brusca is Chief Economist of Fact and Opinion Economics, a consulting firm he founded in Manhattan. He has been an economist on Wall Street for over 25 years. He has visited central banking and large institutional clients in over 30 countries in his career as an economist. Mr. Brusca was a Divisional Research Chief at the Federal Reserve Bank of NY (Chief of the International Financial markets Division), a Fed Watcher at Irving Trust and Chief Economist at Nikko Securities International. He is widely quoted and appears in various media. Mr. Brusca holds an MA and Ph.D. in economics from Michigan State University and a BA in Economics from the University of Michigan. His research pursues his strong interests in non aligned policy economics as well as international economics. FAO Economics’ research targets investors to assist them in making better investment decisions in stocks, bonds and in a variety of international assets. The company does not manage money and has no conflicts in giving economic advice.
More Economy in Brief


