 Global| Dec 16 2004
Housing Starts Fell Sharply
by:Tom Moeller
|in:Economy in Brief
Summary
Housing starts in November fell a sharp 13.1% m/m to 1.771M, reversing all of a 7.0% rise in October.Consensus expectations had been for 1.98M starts. The latest was the lowest level of starts since May 2003. Single-family starts fell [...]
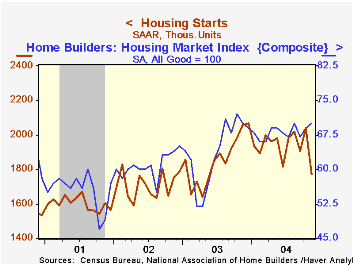
Housing starts in November fell a sharp 13.1% m/m to 1.771M, reversing all of a 7.0% rise in October.Consensus expectations had been for 1.98M starts. The latest was the lowest level of starts since May 2003.
Single-family starts fell 11.7% to 1.448M, also the lowest since May 2003, and multi-family starts dropped 19.0%.
Building permits fell 1.5% m/m to 1.988M after an upwardly revised gain October.
The Composite Housing Market Index from the National Association of Home Builders (NAHB) rose to 71 in December from a downwardly revised November level of 70.
The NAHB index is a diffusion index based on a survey of builders. Readings above 50 signal that more builders view conditions as good than poor.
The index of current single family home sales was stable at its highest in over a year and the index of expected sales in six months rose.
| Housing Starts (000s, AR) | Nov | Oct | Y/Y | 2003 | 2002 | 2001 |
|---|---|---|---|---|---|---|
| Total | 1,771 | 2,039 | -13.8% | 1,8 53 | 1,7 10 | 1,601 |
| Single-family | 1,448 | 1,640 | -13.3% | 1,505 | 1,3 63 | 1,272 |
| Multi-family | 3 23 | 399 | -15.9% | 348 | 347 | 330 |
| Building Permits | 1,988 | 2,018 | 3.5% | 1,8 89 | 1,749 | 1,637 |
by Tom Moeller December 16, 2004
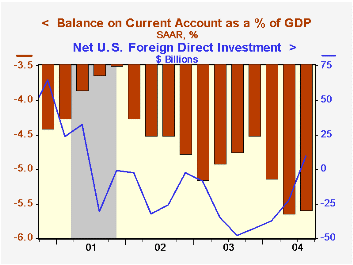
The US current account deficit deepened slightly in 3Q04 to a record $164.7B versus $164.4B the prior quarter, originally reported at $166.2B. Consensus expectations had been for a 3Q deficit of $171.0B.
The deficit in merchandise trade deteriorated to $166.7B from an unrevised $163.6B in 2Q. A 14.8% y/y gain in exports lagged an 18.7% rise in imports.
The surplus on services fell to $11.4B from a downwardly revised to $12.5B in 2Q. Exports of services rose 9.7% y/y while imports rose 13.1%.
From the capital account, US foreign direct investment abroad fell to $43.5B (-3.8% y/y) and foreign direct investment in the US surged to $53.1B, the highest level since 2Q01. The balance of $9.6B was the first positive balance since 2Q01.
| US Int'l Balance of Payments | 3Q '04 | 2Q '04 | Y/Y | 2003 | 2002 | 2001 |
|---|---|---|---|---|---|---|
| Current Account Deficit | $164.7B | $164.4B | $133.9B | $530.7B | $473.9B | $385.7B |
| Goods/Services/Income Deficit | $150.1B | $146.0B | $115.0B | $463.2B | $414.6B | $339.1B |
| Exports | 2.7% | 3.6% | 16.1% | 5.8% | -3.9% | -9.0% |
| Imports | 2.7% | 6.7% | 19.8% | 7.3% | 1.5% | -8.2% |
| Unilateral Transfers Deficit | $14.6B | $18.3B | $16.6B | $67.4 | $59.4B | $46.6B |
by Tom Moeller December 16, 2004
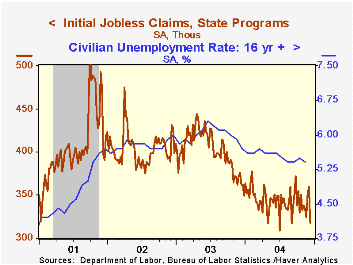
Initial unemployment insurance claims dropped a sharp 43,000 to 317,000 and more than reversed all of the gains during the prior two weeks. The latest was the lowest claims level since early July and the prior week was revised up slightly. The Consensus expectation had been for 345,000 claims.
The four week moving average of initial claims fell to 337,750 (-8.2% y/y).
During the last ten years there has been a (negative) 82% correlation between the level of initial claims and the y/y change in payroll employment.
Continuing claims for unemployment insurance dropped 50,000 following a downwardly revised 69,000 rise the prior week.
The insured rate of unemployment remained at 2.2%, where it's been since early October.
| Unemployment Insurance (000s) | 12/11/04 | 12/04/04 | Y/Y | 2003 | 2002 | 2001 |
|---|---|---|---|---|---|---|
| Initial Claims | 317 | 360 | -12.4% | 402 | 404 | 406 |
| Continuing Claims | -- | 2,737 | -17.8% | 3,531 | 3,570 | 3,018 |
by Tom Moeller December 16, 2004
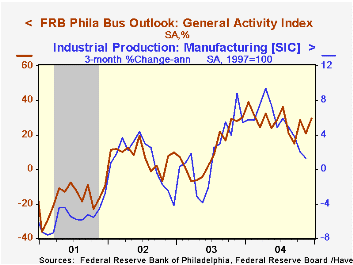
The Philadelphia Fed’s index of general business conditions in the manufacturing sector improved in December to 29.6 from 20.7 the prior month. Only a slight rise to 21.1 had been the Consensus expectation.
During the last ten years there has been a 68% correlation between the level of the Philadelphia Fed Business Conditions Index and three month growth in factory sector industrial production. There has been a 53% correlation with q/q growth in real GDP.
Each of the sub indexes improved m/m with the exception of the index for inventories as well as for the number of employees.
The business conditions index reflects a separate survey question, not the sub indexes.
The separate index of expected business conditions in six months reversed about half of the sharp improvement in November and fell to 41.2.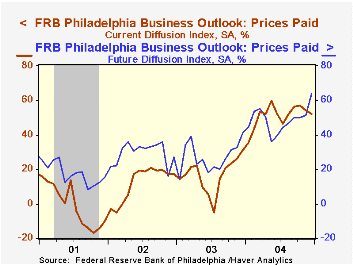
The prices paid index fell for the second month, to 52.2, although expectations for prices surged. During the last ten years there has been a 76% correlation between the prices paid index and the three month growth in the PPI for intermediate goods. The correlation with the finished goods PPI has been 41% and with the CPI it's been 45%.
The Philadelphia Fed index is based on a survey of 250 regional manufacturing firms, but these firms sell nationally and internationally.
The latest Business Outlook survey from the Philadelphia Federal Reserve Bank can be found here.
| Philadelphia Fed Business Outlook | Dec | Nov | Dec '03 | 2004 | 2003 | 2002 |
|---|---|---|---|---|---|---|
| General Activity Index | 29.6 | 20.7 | 30.3 | 27.5 | 10.6 | 7.7 |
| Prices Paid Index | 52.2 | 53.9 | 30.9 | 51.2 | 16.7 | 12.2 |

Tom Moeller
AuthorMore in Author Profile »Prior to joining Haver Analytics in 2000, Mr. Moeller worked as the Economist at Chancellor Capital Management from 1985 to 1999. There, he developed comprehensive economic forecasts and interpreted economic data for equity and fixed income portfolio managers. Also at Chancellor, Mr. Moeller worked as an equity analyst and was responsible for researching and rating companies in the economically sensitive automobile and housing industries for investment in Chancellor’s equity portfolio. Prior to joining Chancellor, Mr. Moeller was an Economist at Citibank from 1979 to 1984. He also analyzed pricing behavior in the metals industry for the Council on Wage and Price Stability in Washington, D.C. In 1999, Mr. Moeller received the award for most accurate forecast from the Forecasters' Club of New York. From 1990 to 1992 he was President of the New York Association for Business Economists. Mr. Moeller earned an M.B.A. in Finance from Fordham University, where he graduated in 1987. He holds a Bachelor of Arts in Economics from George Washington University.
More Economy in Brief


