 Global| Jun 25 2004
Higher Imports Reduced Estimate of 1Q GDP Growth
by:Tom Moeller
|in:Economy in Brief
Summary
US real GDP growth in 1Q was revised down to 3.9% (AR) from the preliminary report of 4.4% growth. The Consensus expectation was for little revision. Next month, the GDP figures back to 1Q 2001 will undergo the regular annual [...]
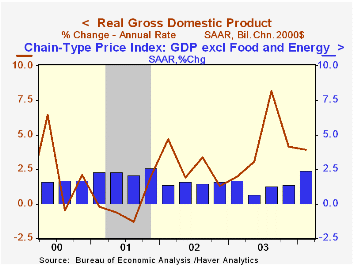
US real GDP growth in 1Q was revised down to 3.9% (AR) from the preliminary report of 4.4% growth. The Consensus expectation was for little revision. Next month, the GDP figures back to 1Q 2001 will undergo the regular annual revision.
The trade sector is now estimated to have subtracted 0.7 percentage points from 1Q GDP growth. Import growth was revised up to 10.4% (AR, 9.0% y/y) from 5.9%. Export growth of 7.5% (8.9% y/y) also was revised up.
Growth in domestic final demand was little revised as personal consumption expenditures grew 3.8% (AR, 4.3% y/y), though growth in nonresidential fixed investment growth was reduced to 5.3% (AR, 8.9% y/y). Investment in equipment & software was lowered to 9.2% (12.4% y/y) from 9.8%. Residential investment growth was revised up to 4.6% (9.5% y/y).
Growth in before tax corporate profits with inventory valuation adjustment (IVA) & capital consumption adjustment (CCA) was revised slightly higher to 7.1% from 4.9% (AR, 32.3% y/y). Growth in operating profits for nonfinancial corporations grew 6.9% (AR, 38.8% y/y) and was revised up from 3.6%, though profit margins were unrevised. They still show no expansion versus 4Q but are about two thirds higher than in 2001.
Inflation was revised up slightly to 2.8% as the gain in the PCE chain price index was revised up to 3.2% (1.6% y/y). Business equipment & software prices were revised down to a 0.3% decline (0.0% y/y).Less food & energy the GDP chain price index rose 2.4% after the 1.4% rise in 4Q.
| Chained 2000$, % AR | 1Q '04 (Final) |
1Q '04 (Prelim.) |
4Q '03 (Final) |
Y/Y | 2003 | 2002 | 2001 |
|---|---|---|---|---|---|---|---|
| GDP | 3.9% | 4.4% | 4.1% | 4.8% | 3.1% | 2.2% | 0.5% |
| Inventory Effect | 0.7% | 0.8% | 0.7% | 0.2% | -0.1% | 0.4% | -0.9% |
| Final Sales | 3.2% | 3.7% | 3.4% | 4.6% | 3.2% | 1.8% | 1.4% |
| Trade Effect | -0.7% | -0.4% | -0.3% | -0.2% | -0.2% | -0.6% | -0.2% |
| Domestic Final Demand | 3.8% | 3.9% | 3.6% | 4.8% | 3.4% | 2.4% | 1.6% |
| Chained GDP Price Index | 2.8% | 2.6% | 1.5% | 1.8% | 1.7% | 1.5% | 2.4% |
by Tom Moeller June 25, 2004
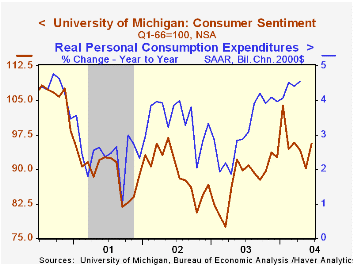
The University of Michigan’s consumer sentiment index for June improved to95.6, up slightly from the mid-month read of 95.2. Consensus expectations had been for 95.0.
During the last ten years there has been a 75% correlation between the level of consumer sentiment and the y/y change in real PCE.
Improvement in the expectations sub-index versus the mid-month reading as well as versus May drove the rise in overall consumer sentiment. The index of current economic conditions actually fell versus the mid-month read but was still up 3.0% versus May.
The University of Michigan survey is not seasonally adjusted.The mid-month survey is based on telephone interviews with 250 households nationwide on personal finances and business and buying conditions. The survey is expanded to a total of 500 interviews at month end.
| University of Michigan | June | May | Y/Y | 2003 | 2002 | 2001 |
|---|---|---|---|---|---|---|
| Consumer Sentiment | 95.6 | 90.2 | 6.1% | 87.6 | 89.6 | 89.2 |
| Current Conditions | 106.7 | 103.6 | 14.1% | 97.2 | 97.5 | 100.1 |
| Consumer Expectations | 88.5 | 81.6 | 0.6% | 81.4 | 84.6 | 82.3 |
by Tom Moeller June 25, 2004
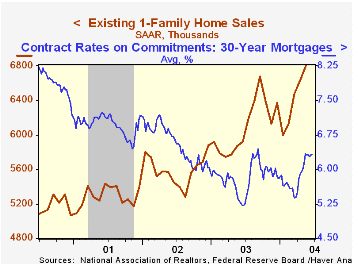
The National Association of Realtors reported that sales of existing single family homes in May rose 2.6% to a record high of 6.80M. Consensus expectations had been for sales 6.50M. April sales were revised down slightly.
Sales were mixed across the nation. In the South they rose 3.8% (+19.0% y/y) and in the West sales rose 5.5% (22.9% y/y). However in the Northeast sales fell 1.4% (+7.5% y/y), unchanged since February, and in the Midwest sales fell 0.7% (+6.1% y/y).
The median price of an existing home rose 3.7% m/m to $183,600 (+10.3% y/y).
The figures reflect closings of home sales in earlier months.
The latest release from the National Association of Realtors is available here.
| Existing Home Sales (000, AR) | May | April | Y/Y | 2003 | 2002 | 2001 |
|---|---|---|---|---|---|---|
| Existing Single-Family | 6,800 | 6,630 | 15.8% | 6,098 | 5,593 | 5,290 |
by Tom Moeller June 25, 2004
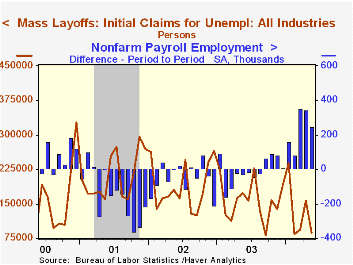
Mass layoffs in the US as reported to the Bureau of Labor Statistics fell sharply in May, continuing a downtrend begun in 2001.
The number of firms reporting mass layoffs in May fell to 988 from 1,458 in April and from a monthly average of 1,580 last year.
These layoffs generated 87,501 initial claims for unemployment insurance in May. That was down from 157,410 initial claims generated each month last year.
Since the series inception in 1995 there has been a (negative) 47% correlation between the number of initial claims generated by mass layoffs and the one month change in non-farm payrolls.
The Mass Layoff Statistics (MLS) program collects reports on mass layoff actions that result in workers being separated from their jobs. Monthly mass layoff numbers are from establishments which have at least 50 initial claims for unemployment insurance (UI) filed against them during a 5-week period. Extended mass layoff numbers (issued quarterly) are from a subset of such establishments--where private sector non-farm employers indicate that 50 or more workers were separated from their jobs for at least 31 days.
| Mass Layoffs | May | April | Y/Y | 2003 | 2002 | 2001 |
|---|---|---|---|---|---|---|
| Number of Events: All Industries | 988 | 1,458 | -42.0% | 18,963 | 20,277 | 21,467 |
| Numbers of Persons Filing Initial Unemployment Insurance Claim: All Industries | 87,501 | 157,314 | -49.8% | 1,888,926 | 2,245,051 | 2,514,862 |

Tom Moeller
AuthorMore in Author Profile »Prior to joining Haver Analytics in 2000, Mr. Moeller worked as the Economist at Chancellor Capital Management from 1985 to 1999. There, he developed comprehensive economic forecasts and interpreted economic data for equity and fixed income portfolio managers. Also at Chancellor, Mr. Moeller worked as an equity analyst and was responsible for researching and rating companies in the economically sensitive automobile and housing industries for investment in Chancellor’s equity portfolio. Prior to joining Chancellor, Mr. Moeller was an Economist at Citibank from 1979 to 1984. He also analyzed pricing behavior in the metals industry for the Council on Wage and Price Stability in Washington, D.C. In 1999, Mr. Moeller received the award for most accurate forecast from the Forecasters' Club of New York. From 1990 to 1992 he was President of the New York Association for Business Economists. Mr. Moeller earned an M.B.A. in Finance from Fordham University, where he graduated in 1987. He holds a Bachelor of Arts in Economics from George Washington University.
More Economy in Brief


