 Global| Dec 08 2009
German Industrial Production Falls In October
Summary
German Industrial Production declined almost 2% to 95.7 (2005=100) in October, from 97.5 in September. Although expectations had been for a small rise, yesterday's sobering report on new orders should have dampened expectations. Among [...]
 German
Industrial Production declined almost 2% to 95.7 (2005=100) in October,
from 97.5 in September. Although expectations had been for a
small rise, yesterday's sobering report on new orders should have
dampened expectations.
German
Industrial Production declined almost 2% to 95.7 (2005=100) in October,
from 97.5 in September. Although expectations had been for a
small rise, yesterday's sobering report on new orders should have
dampened expectations.
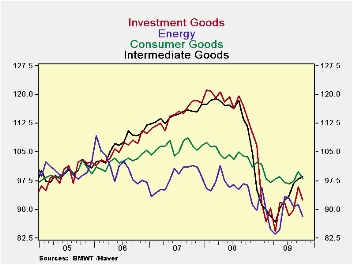
Among the Main Industrial Groups, the biggest declines were in the production of investment goods, 3.55%, and in that of energy, 3.40%. Production of consumer goods also declined but to a lesser extent, 1.90%. Production of intermediate goods was actually up, 0.61%. As reported yesterday, domestic orders for intermediate goods were up sharply. The first chart shows the indexes for the four Main Industrial Groups.
 More
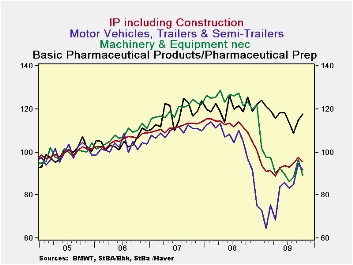
specific information on production is
available in the detailed breakdown of production. Production
of machinery and equipment, nec, declined 7.56% from September to
October, production of coke and refined petrol products was down 3.86%
and motor vehicle production was down 3.27%. Surprisingly,
some of the largest declines were in food, beverages and tobacco,
3.59%, and textiles, 5.04%. Production of computers and
pharmaceuticals were notable exceptions to the October
decline. Computers, electronic and optical products and
electric equipment rose 2.25% and basic pharmaceutical products and
preparations rose 2.35%. Total Industrial Production,
together with production of machinery and equipment, nec, motor
vehicles and pharmaceutical products are shown in the second
chart.
More
specific information on production is
available in the detailed breakdown of production. Production
of machinery and equipment, nec, declined 7.56% from September to
October, production of coke and refined petrol products was down 3.86%
and motor vehicle production was down 3.27%. Surprisingly,
some of the largest declines were in food, beverages and tobacco,
3.59%, and textiles, 5.04%. Production of computers and
pharmaceuticals were notable exceptions to the October
decline. Computers, electronic and optical products and
electric equipment rose 2.25% and basic pharmaceutical products and
preparations rose 2.35%. Total Industrial Production,
together with production of machinery and equipment, nec, motor
vehicles and pharmaceutical products are shown in the second
chart.
Industrial production rarely proceeds in an smooth trend. The October decline may be only a slight interruption like the July decline that was quickly reversed. A continuation of the decline in the Euro that started last Thursday would do much to stimulate German production.
| GERMANY INDUSTRIAL PRODUCTION (2005=100) | Oct 09 | Sep 09 | Oct 08 | M/M % CHG | Y/Y %CHG | 2008 | 2007 | 2006 |
|---|---|---|---|---|---|---|---|---|
| Total | 95.7 | 97.5 | 109.3 | -1.85 | -12.44 | 111.5 | 111.6 | 105.4 |
| Intermediate Goods | 98.5 | 97.9 | 111.6 | 0.61 | -11.74 | 114.0 | 114.6 | 107.1 |
| Investment Goods | 98.5 | 97.9 | 113.6 | -3.55 | -18.57 | 116.9 | 114.8 | 105.9 |
| Consumer Goods | 98.0 | 99.9 | 103.9 | -1.90 | -5.68 | 104.3 | 106.3 | 102.7 |
| Energy | 88.1 | 91.2 | 96.4 | -3.40 | -8.61 | 95.7 | 98.3 | 100.9 |
| Machinery and Equipment, nec | 89.2 | 96.5 | 123.0 | -7.56 | -27.95 | 124.6 | 119.4 | 107.4 |
| Motor Vehicles | 91.7 | 94.8 | 97.0 | -3.27 | -5.46 | 104.2 | 109.6 | 102.6 |
| Computers, electronic & optical products & elec. eq. | 104.3 | 102.0 | 124.7 | 2.25 | -16.36 | 128.4 | 124.3 | 112.8 |
| Basic Pharmaceutical products and preparations | 117.5 | 114.8 | 125.5 | 2.35 | -6.37 | 120.5 | 117.5 | 104.7 |
More Economy in Brief


