 Global| Sep 21 2004
FOMC Raised Funds Rate for Third Time
by:Tom Moeller
|in:Economy in Brief
Summary
The Federal Open Market Committee raised the target rate for federal funds by 25 basis points to 1.75%, as expected. The discount rate also was raised 25 basis points to 2.75%. The decision was unanimous. Today's press release from [...]
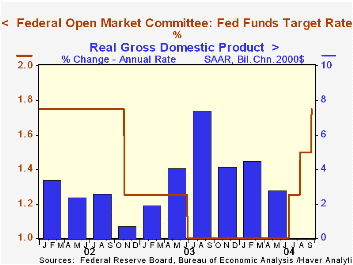
The Federal Open Market Committee raised the target rate for federal funds by 25 basis points to 1.75%, as expected. The discount rate also was raised 25 basis points to 2.75%.
The decision was unanimous.
Today's press release from the Fed again contained comments suggesting that rates could be raised again. "The Committee believes that, even after this action, the stance of monetary policy remains accommodative and, coupled with robust underlying growth in productivity, is providing ongoing support to economic activity." These comments are identical to the Fed's last.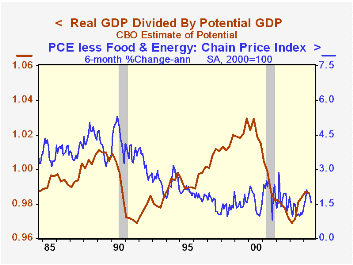
The Fed's statement noted that the economy "appears to have regained some traction" after moderating in reaction to higher energy prices.
For the complete text of the Fed's latest press release please click here.
Today's action by the FOMC seems more to address market inflationary expectations rather than economic growth or inflation directly. As the accompanying chart indicates, price inflation during the last twenty years has not been very responsive to whether the US economy was operating above or below its potential.
The role of money in determining inflation is discussed here by the Federal Reserve Bank of Richmond in a report titled "How Do Central Banks Control Inflation?."
"1994", a commentary on past FOMC action from the Federal Reserve Bank of St. Louis is available here.
August Housing Starts At Year's Highby Tom Moeller September 21, 2004
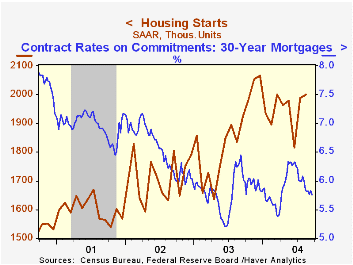
Housing starts added a slight 0.6% last month to the upwardly revised 9.4% jump in July.At 2.000 mil., starts were at the highest level of 2004 and year to date have averaged 5.1% above 2003. The Consensus forecast had been for 1.94M starts for August.
Single-family starts rose 0.4% on the heels of the 9.2% jump the prior month. Year to date single family starts have averaged 6.5% above last year's average.
Multi-family starts rose 1.5% in August but for the year have averaged 1.1% below 2003.
Housing starts rose in August throughout the country with the exception of the West. Year to date 2004 changes versus 2003 by region are as follows: Northeast, 8.0%; Midwest, -5.1%; South, 7.7%; West, 7.1%.
Building permits fell 5.5% m/m and reversed most of the 6.2% July gain.
"Can a Summer Hike Cause a Surprise Fall for Mortgage Rates?" from the Federal Reserve Bank of St. Louis can be found here.
| Housing Starts (000s, AR) | Aug | July | Y/Y | 2003 | 2002 | 2001 |
|---|---|---|---|---|---|---|
| Total | 2,000 | 1,988 | 9.0% | 1,853 | 1,710 | 1,601 |
| Single-family | 1,667 | 1,660 | 11.6% | 1,505 | 1,363 | 1,272 |
| Multi-family | 333 | 328 | -2.3% | 348 | 347 | 330 |
| Building Permits | 1,952 | 2,066 | -0.6% | 1,889 | 1,749 | 1,637 |
by Tom Moeller September 21, 2004
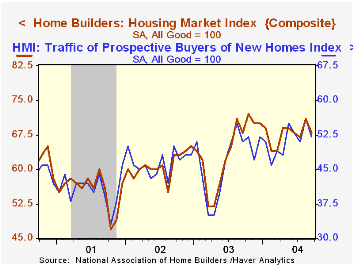
The Composite Housing Market Index reported by the National Association of Home Builders (NAHB) backpedaled in September to 68 and reversed nearly all of the gain in August.
The NAHB index is a diffusion index based on a survey of builders. Readings above 50 signal that more builders view conditions as good than poor.
The index of current single family home sales reversed more than all of the August gain and the index of expected sales during the next six months fell more moderately.
The index of traffic of prospective buyers fell to 52 but remained at a relatively high level.
Visit the National Association of Home Builders using this link.
| Nat'l Association of Home Builders | Sept | Aug | Sept '03 | 2003 | 2002 | 2001 |
|---|---|---|---|---|---|---|
| Composite Housing Market Index | 68 | 71 | 68 | 64 | 61 | 56 |
by Tom Moeller September 21, 2004
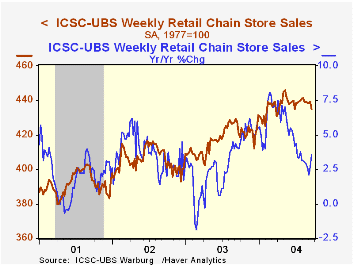
Chain store sales dropped 1.1% last week, according to the International Council of Shopping Centers (ICSC)-UBS, as Hurricane Ivan slammed into the Gulf Coast.
The decline lowered September sales so far 0.4% below the August average which was unchanged from July.
During the last ten years there has been a 60% correlation between y/y change in chain store sales and the change in non-auto retail sales less gasoline.
The ICSC-UBS retail chain-store sales index is constructed using the same-store sales reported by 78 stores of seven retailers: Dayton Hudson, Federated, Kmart, May, J.C. Penney, Sears and Wal-Mart.
| ICSC-UBS (SA, 1977=100) | 09/18/04 | 09/11/04 | Y/Y | 2003 | 2002 | 2001 |
|---|---|---|---|---|---|---|
| Total Weekly Retail Chain Store Sales | 434.7 | 439.4 | 3.5% | 2.9% | 3.6% | 2.1% |

Tom Moeller
AuthorMore in Author Profile »Prior to joining Haver Analytics in 2000, Mr. Moeller worked as the Economist at Chancellor Capital Management from 1985 to 1999. There, he developed comprehensive economic forecasts and interpreted economic data for equity and fixed income portfolio managers. Also at Chancellor, Mr. Moeller worked as an equity analyst and was responsible for researching and rating companies in the economically sensitive automobile and housing industries for investment in Chancellor’s equity portfolio. Prior to joining Chancellor, Mr. Moeller was an Economist at Citibank from 1979 to 1984. He also analyzed pricing behavior in the metals industry for the Council on Wage and Price Stability in Washington, D.C. In 1999, Mr. Moeller received the award for most accurate forecast from the Forecasters' Club of New York. From 1990 to 1992 he was President of the New York Association for Business Economists. Mr. Moeller earned an M.B.A. in Finance from Fordham University, where he graduated in 1987. He holds a Bachelor of Arts in Economics from George Washington University.
More Economy in Brief


