 Global| Apr 30 2008
FOMC Lowers Fed Funds Rate by 25 Basis Points
by:Tom Moeller
|in:Economy in Brief
Summary
The Federal Open Market Committee again lowered the Federal funds rate today by 25 basis points to 2.00% in a move that was widely expected. The funds rate was last this low in December, 2004. The discount rate was lowered another 25 [...]
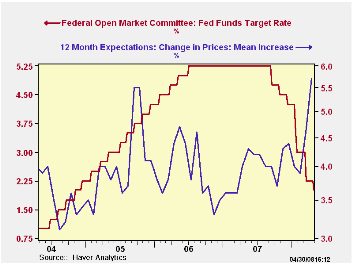
The Federal Open Market Committee again lowered the Federal funds rate today by 25 basis points to 2.00% in a move that was widely expected. The funds rate was last this low in December, 2004.
The discount rate was lowered another 25 basis points to 2.25%.
The Fed indicated "Recent information indicates that economic activity remains weak. Household and business spending has been subdued and labor markets have softened further."
Regarding price inflation it was stated "Although readings on core inflation have improved somewhat, energy and other commodity prices have increased, and some indicators of inflation expectations have risen in recent months."
Voting against taking the action was Richard W. Fisher, President of the Federal Reserve Bank of Dallas and Charles I. Plosser, President of the Philadelphia Fed, who preferred no change in rates.
For the complete text of the Fed's latest press release please follow this link.
Are Global Imbalances Due to Financial Underdevelopment in Emerging Economies? from the Federal Reserve Bank of San Francisco is available here.
| Current | Last | March | 2007 | 2006 | 2005 | |
|---|---|---|---|---|---|---|
| Federal Funds Rate, % (Target) | 2.00 | 2.25 | 2.64 | 5.05 | 4.96 | 3.19 |
| Discount Rate, % | 2.25 | 2.50 | 3.17 | 5.88 | 5.95 | 4.18 |
by Tom Moeller April 30, 2008
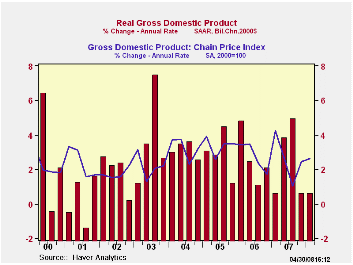
U.S. real GDP growth during 1Q'08 remained stable with the prior quarter at 0.6%, about as expected. Together, growth during the last two quarters was the weakest since the end of the last recession in 2001.
Negative 0.4% 1Q growth in final sales to domestic purchasers was the first sub-zero reading since the earlier recession in 1991.
Residential construction led that slip with a 26.6% (-21.2% y/y) drop which was the fastest rate of decline since the recession in 1981. For the quarter it alone reduced overall real GDP growth by 1.2 percentage points.
Business fixed investment also was weak and
posted a 2.5% (+5.8% y/y) decline which was its first negative print
since 4Q'06 and the largest negative reading since early 2004. Overall
it reduced 1Q GDP growth by 0.3 percentage points. The decline was
paced by a 6.2% (+11.5% y/y) decline in investment in structures while
equipment spending fell at a 0.7% rate (+3.3% y/y). That decline
represented a shortfall in investment in transportation equipment while
growth in information processing equipment and also industrial
equipment remained positive. 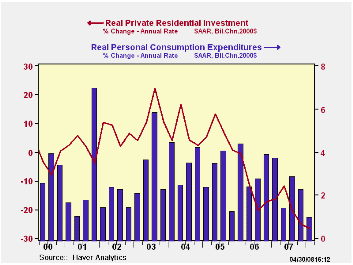
Growth in real personal consumption also weakened to just 1.0% (1.9% y/y) which was its weakest since the recession year 2001. Fewer purchases of autos & light trucks reduced spending here at an 11.4% (-4.3% y/y) while spending on furniture & other household equipment also fell. In the nondurable area, spending on food as well as gasoline both dropped. Spending on services actually accelerated slightly due to faster growth in spending on household operation. Growth in real PCE added 0.7 percentage point to 1Q real GDP growth.
Earlier sizable additions to GDP growth from an improved foreign trade deficit eased to just a 0.2 percentage point contribution in 1Q. The lessened addition was due to weaker growth in exports of 5.5% after an 8.1% rise last year and an 8.4% gain in 2006. Imports grew at a 2.5% rate after a 1.9% rise last year and a 5.9% 2006 rise.
Faster inventory accumulation added 0.8 percentage points to 1Q GDP growth but that only made up some of the 1.8 point subtraction in 4Q.
The GDP chain price index grew at a 2.6% annual rate which was its fastest gain in three quarters. The PCE price index rose at a 3.5% rate (3.4% y/y) which was down slightly from the 3.9% rise in 4Q. Less food & energy consumer prices rose at a 2.2% rate which was stable with growth during the prior four years. The price index for business fixed investment fell a slight 0.1% which was the third decline in the last four quarters but prices for residential investment fell at a 2.3% rate which was the fastest rate of decline since 1970 (no typo). Quicker growth in the overall GDP price index was due to exports (9.0% y/y) and government consumption (6.9% y/y).
| Chained 2000$, % AR | 1Q '08 | 4Q '07 | 3Q '07 | Y/Y | 2007 | 2006 | 2005 |
|---|---|---|---|---|---|---|---|
| GDP | 0.6 | 0.6 | 4.9 | 2.5 | 2.2 | 2.9 | 3.1 |
| Inventory Effect | 0.8 | -1.8 | 0.9 | 0.1 | -0.3 | 0.1 | -0.2 |
| Final Sales | -0.2 | 2.4 | 4.0 | 2.4 | 2.5 | 2.8 | 3.3 |
| Foreign Trade Effect | 0.2 | 1.0 | 1.4 | 1.0 | 0.7 | -0.1 | -0.2 |
| Domestic Final Demand | -0.4 | 1.3 | 2.5 | 1.4 | 1.8 | 2.7 | 3.3 |
| Chained GDP Price Index | 2.6 | 2.4 | 1.0 | 2.2 | 2.7 | 3.2 | 3.2 |
by Tom Moeller April 30, 2008
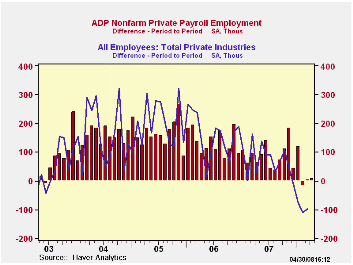
The ADP National Employment Report, from the payroll processor, reported that private nonfarm payrolls rose 10,000 this month after a slightly revised increase of 3,000 during March.
The U.S. Bureau of Labor Statistics employment figure for April will be published this Friday.Last month the 3,000 worker rise in ADP's measure of private nonfarm payrolls was accompanied by a 98,000 worker decline in private sector payrolls as reported by BLS.According to ADP and Macro Advisers, the correlation between the monthly percentage change in the ADP estimate and that in the BLS data is 0.90.
The ADP sub-index for large payrolls fell 18,000 (-0.9% y/y) after a 53,000 worker decline during March.
A 42,000 worker increase (1.3% y/y) in small sized payrolls during April followed the 53,000 March rise.

Medium sized payrolls fell 14,000 (+0.8% y/y) and that followed a 3,000 worker March increase.
Employment in the goods producing industries fell 54,000 (-2.0% y/y) and the rate of decline has intensified as this year has progressed. Services payrolls rose 64,000 (1.4% y/y).
ADP compiled the estimate from its database of individual companies' payroll information. Macroeconomic Advisers, LLC, the St. Louis economic consulting firm, developed the methodology for transforming the raw data into an economic indicator.
The ADP National Employment Report data is maintained in Haver's
USECON database; historical data go back to December 2000. The figures in this report cover only private sector jobs and exclude employment in the public sector, which rose an average 11,083 during the last twelve months.The full ADP National Employment Report can be found here, and the ADP methodology is explained here.
| LAXEPA@USECON | April | March | Y/Y | 2007 | 2006 | 2005 |
|---|---|---|---|---|---|---|
| Nonfarm Private Payroll Employment (m/m Chg.) | 10,000 | 3,000 | 0.7% | 1.1% | 1.7% | 1.8% |
by Tom Moeller April 30, 2008
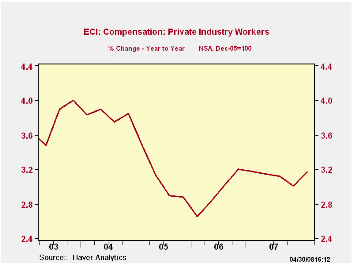
Rising 0.8% last quarter, the employment cost index for
private industry workers remained about steady with the 4Q '07
increase. The gain matched Consensus expectations. In addition, the
gain in total compensation in 1Q was roughly steady at 3.2% with the
gains since 2005.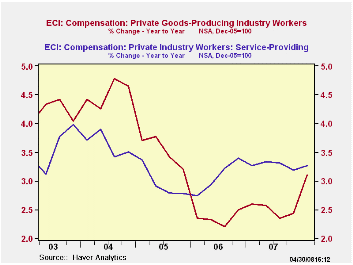
During the last twenty years there has been a 54% correlation between the growth in employee compensation and the rise in the PCE price index. That level of correlation goes neither up or down, when either series is led or lagged the other. This suggests a self reinforcing effect between the two series.
Wage and salary growth held steady at 0.8%. Wages account for roughly 70% of the compensation index. Wages in the services industries rose 0.7% (3.2% y/y). Wages in the goods producing industries rose at an accelerated 1.0% (3.2% y/y).
The rise in benefit costs eased to 0.6% after a 0.8% 4Q rise. The rise in benefit costs in the service producing industries slipped to 0.6% (3.3% y/y) but in the goods producing sector benefits rose 0.8% (3.1% y/y). That is double the recent rates of growth.
Health benefit costs rose a steady 4.6% y/y.
| ECI- Private Industry Workers | 1Q '08 | 4Q '07 | 3Q '07 | 1Q Y/Y | 2007 | 2006 | 2005 |
|---|---|---|---|---|---|---|---|
| Compensation | 0.8% | 0.9% | 0.8% | 3.2% | 3.1% | 2.9% | 3.1% |
| Wages & Salaries | 0.8% | 0.8% | 0.8% | 3.2% | 3.4% | 2.9% | 2.5% |
| Benefit Costs | 0.6% | 0.8% | 0.8% | 3.2% | 2.4% | 2.9% | 4.6% |
by Robert Brusca April 30, 2008
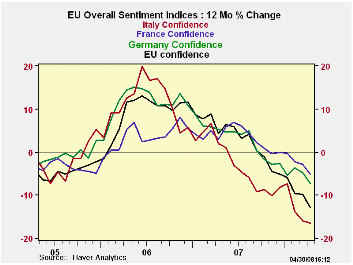
If they were ski runs, they’d be black diamonds.
The EU sentiment index fell sharply in April with declines in all sectors and with all sector readings south of zero except services. Ironically the service sector is the weakest of the lot in terms of its standing as a percentile of its range. That standing is the 31st percentile Consumer confidence is the next weakest measure in its 51st percentile followed by retailing in the 55th percentile. The industrial sector for which we get the most data is in its 73rd range percentile, the strongest of the lot. Overall the EU index is in its 57th percentile and above its average and range midpoint.
Percentiles give us an idea of the relative standing of each sector since each has a different intrinsic range and variability. Looking at percentiles helps us to see where the weakness is hitting the hardest.
EMU is in the 54.6th percentile of its range. Within EMU among the large countries France ranks in its 67th percentile, Germany is in its 60th, Italy is in the 41st, and Spain is in the weakest of these, 27th percentile of its range.
The chart shows that the pace of the slide is as yet, unabated.
For industrial production expectations and order volumes are still firm in their respective 65th and 77th range percentiles. Among large EMU countries Germany and France are in league unto themselves as their respective 78th and 71st percentile standings are high; Italy and Spain are at lower rankings in percentile terms.
The consumer situation is best in Germany where consumer sentiment still in the 75th percentile of its range; in France confidence is down to the 50th percentile Italy’s consumer sentiment is in the 37th percentile and for Spain its the 27th percentile. For the UK the confidence measure is in its 42nd percentile.
Notwithstanding these results the French retail sector is in the 80th percentile of its range in April followed by Italy in the 75th percentile – despite a sour consumer. Germany, with the most upbeat consumer, finds retail confidence in the 40th percentile. Spain’s consumers are weak with retailing in the bottom 4 percent of its range. The UK retail sector reading fell sharply in April to -17 from -1 in March marking a 28th percentile reading in its range.
The services sector rankings show France’s service sector is in the 58th percentile, and Germany’s in the 41st percentile. For Italy the service sector is much worse off, in the bottom 6% of it range near Spain’s reading that is at an all time low reading in April. Spain’s service sector shed 6 points to drop from -8 to -14 in raw terms in one month. UK services also fell hard to -6 from +13 and to a 29 percentile ranking.
On balance the EMU and EU readings show a great deal of distress and some of it quite recent. The country by country findings are revealing. What remains curious is that amid all the concern about the strong euro the service sector is getting hit so hard. Some of that may be financial turbulence. In any event the extent of financial sector weakness is striking. It seems a good time to put Europe on a weakness watch. For the industrial sector even selling price expectations have been reduced somewhat to the 61st percentile they are not one of the stronger industrial components anymore. Does that mean that inflation is not so much of a risk?
| EU Sectors and Country level Overall Sentiment | |||||||||||
|---|---|---|---|---|---|---|---|---|---|---|---|
| EU | Apr 08 |
Mar 08 |
Feb 08 |
Jan 08 |
%tile | Rank | Max | Min | Range | Mean | R-SQ w/ Overall |
| Overall | 98.1 | 101.9 | 100.3 | 103.3 | 57.9 | 122 | 116 | 73 | 43 | 100 | 1.00 |
| Industrial | -2 | 0 | 0 | 2 | 73.5 | 64 | 7 | -27 | 34 | -7 | 0.88 |
| Consumer Confid | -12 | -11 | -11 | -10 | 51.7 | 124 | 2 | -27 | 29 | -10 | 0.83 |
| Retail | -6 | 1 | 1 | -3 | 55.6 | 100 | 6 | -21 | 27 | -6 | 0.47 |
| Construction | -11 | -9 | -7 | -4 | 68.9 | 75 | 3 | -42 | 45 | -17 | 0.43 |
| Services | 6 | 11 | 6 | 11 | 31.6 | 105 | 32 | -6 | 38 | 17 | 0.81 |
| % m/m | Apr 08 |
Based on Level | Level | ||||||||
| EMU | -2.5% | -0.6% | -1.5% | 97.1 | 54.6 | 124 | 117 | 73 | 44 | 99 | 0.95 |
| Germany | -1.2% | 0.3% | 0.6% | 102.8 | 60.0 | 85 | 119 | 79 | 40 | 99 | 0.70 |
| France | -2.4% | 0.0% | -1.3% | 103.1 | 67.1 | 97 | 119 | 72 | 47 | 100 | 0.79 |
| Italy | -1.7% | -1.3% | -3.7% | 92.1 | 41.6 | 167 | 121 | 71 | 50 | 100 | 0.78 |
| Spain | -3.8% | -4.1% | -3.4% | 80.7 | 27.2 | 193 | 118 | 67 | 51 | 100 | 0.63 |
| Memo: UK | -8.5% | 10.7% | -8.7% | 95.8 | 54.7 | 147 | 118 | 69 | 50 | 101 | 0.43 |
| Since 1990 except Services (Oct 1996): 208 | -Count | Services: | 126 | -Count | |||||||
| Sentiment is an index, sector readings are net balance diffusion measures | |||||||||||

Tom Moeller
AuthorMore in Author Profile »Prior to joining Haver Analytics in 2000, Mr. Moeller worked as the Economist at Chancellor Capital Management from 1985 to 1999. There, he developed comprehensive economic forecasts and interpreted economic data for equity and fixed income portfolio managers. Also at Chancellor, Mr. Moeller worked as an equity analyst and was responsible for researching and rating companies in the economically sensitive automobile and housing industries for investment in Chancellor’s equity portfolio. Prior to joining Chancellor, Mr. Moeller was an Economist at Citibank from 1979 to 1984. He also analyzed pricing behavior in the metals industry for the Council on Wage and Price Stability in Washington, D.C. In 1999, Mr. Moeller received the award for most accurate forecast from the Forecasters' Club of New York. From 1990 to 1992 he was President of the New York Association for Business Economists. Mr. Moeller earned an M.B.A. in Finance from Fordham University, where he graduated in 1987. He holds a Bachelor of Arts in Economics from George Washington University.
More Economy in Brief


