 Global| Sep 20 2004
Employment in Hong Kong Continues to Shift from Manufacturing and Construction to Services
Summary
Data on the industrial composition of employment in Hong Kong were released today. Although these data refer only to the second quarter of the year, in contrast to the more up-to-date overall data that Carol Stone commented on last [...]
Data on the industrial composition of employment in Hong Kong were released today. Although these data refer only to the second quarter of the year, in contrast to the more up-to-date overall data that Carol Stone commented on last week, they shed light on the movement of employees within the labor market.
The data are from the Quarterly Surveys of Employment and Vacancies and of Construction Sites. Data for the mining, quarrying, electricity and gas sectors are not included.
The general weakness of the labor market in comparison with the pre 1997 era, noted by Carol Stone, is evident in these data. Except for the those employed in the community, social and personal sector, employment in all the other sectors declined in the last three years. However, the rates of decline differed significantly. The greatest weakness has been in the manufacturing and construction sectors. While the data show some improvement in the manufacturing and construction sectors in second quarter of this year, the year over year comparisons are still negative. The remaining sectors--largely service related sectors--have begun to show significant increases.
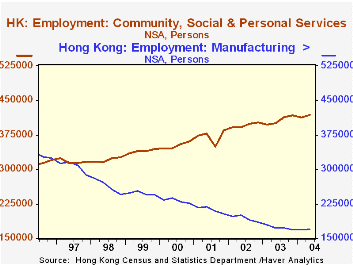
The attached chart comparing employment in the manufacturing sector with that in the community, social and personal sector, as a representative of the service sector, dramatizes the shift in employment from manufacturing to services.
| Employment (Thousands of Persons) |
Q2 04 | Q1 04 | Q2 03 | Q/Q % |
Y/Y % |
2003 % | 2002 % | 2001 % |
|---|---|---|---|---|---|---|---|---|
| Manufacturing | 169.6 | 168.9 | 172.9 | 0.41 | -1.68 | -10.31 | -8.85 | -8.63 |
| Construction | 66.6 | 66.1 | 67.3 | 0.76 | -1.04 | -10.04 | -8.81 | 0.88 |
| Wholesale, retail, export/import trade, hotels and restaurants | 989.2 | 975.8 | 958.4 | 1.37 | 3.21 | -3.02 | -2.33 | -1.22 |
| Transport, storage and communication | 178.9 | 176.1 | 170.9 | 1.59 | 4.68 | -4.39 | -1.79 | 2.37 |
| Finance, Insurance and real estate | 434.2 | 428.6 | 419.0 | 1.31 | 3.63 | -1.68 | -1.32 | 1.60 |
| Community, social and personal services | 418.2 | 412.0 | 400.6 | 1.48 | 4.37 | 2.89 | 6.76 | 5.41 |
More Economy in Brief


