 Global| Apr 30 2020
Employment Cost Growth Edges Up
by:Sandy Batten
|in:Economy in Brief
Summary
• Growth of overall compensation unexpectedly picked up to 0.8% q/q in 2020 Q1. • Wages and salaries growth accelerated while benefits slowed. The employment cost index (ECI) for civilian workers rose 0.8% q/q in the first quarter of [...]
• Growth of overall compensation unexpectedly picked up to 0.8% q/q in 2020 Q1.
• Wages and salaries growth accelerated while benefits slowed.
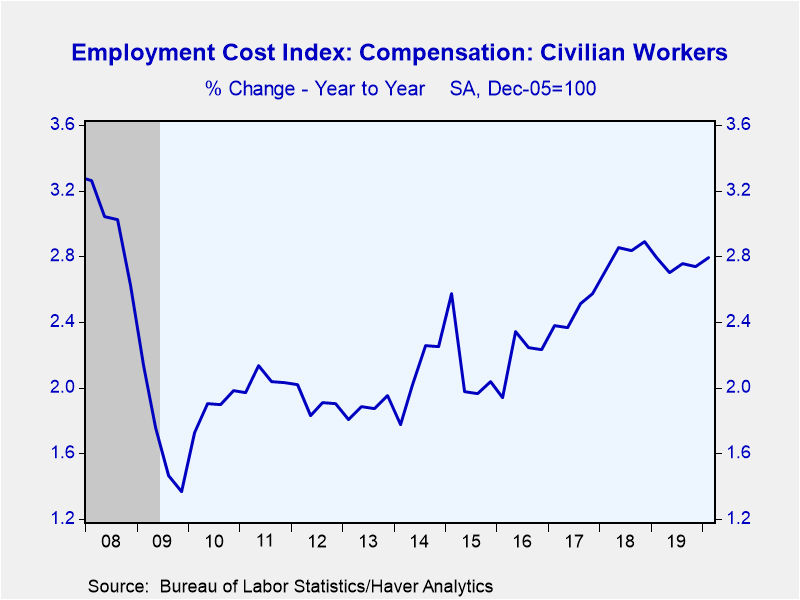
The employment cost index (ECI) for civilian workers rose 0.8% q/q in the first quarter of 2020, up slightly from a 0.7% q/q rise in last year's fourth quarter. This was contrary to the Action Economics Forecast Survey which had looked for compensation growth to slow to 0.6% q/q. Year-on-year growth of total compensation also picked up slightly to 2.8% y/y in Q1 versus 2.7% in Q4. Annual compensation growth hit a cycle high of 2.9% in 2018 Q4.
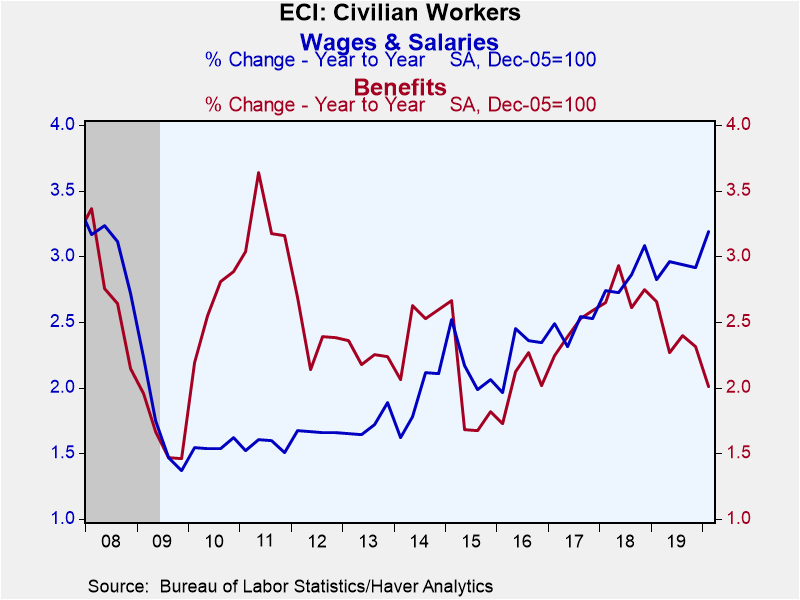
Wage and salaries increased 0.9% q/q in Q1 (3.1% y/y), a reacceleration from the 0.7% gain in Q4. Year-on-year growth rose to 3.1% from 2.9% in Q4 to match 2018 Q4 as the fastest pace of wage and salaries growth since 2008 Q2. In contrast, benefits growth slowed to 0.4% q/q (2.1% y/y) from 0.6% in Q4. The year-on-year gain in Q1 was the softest since 2016 Q4.
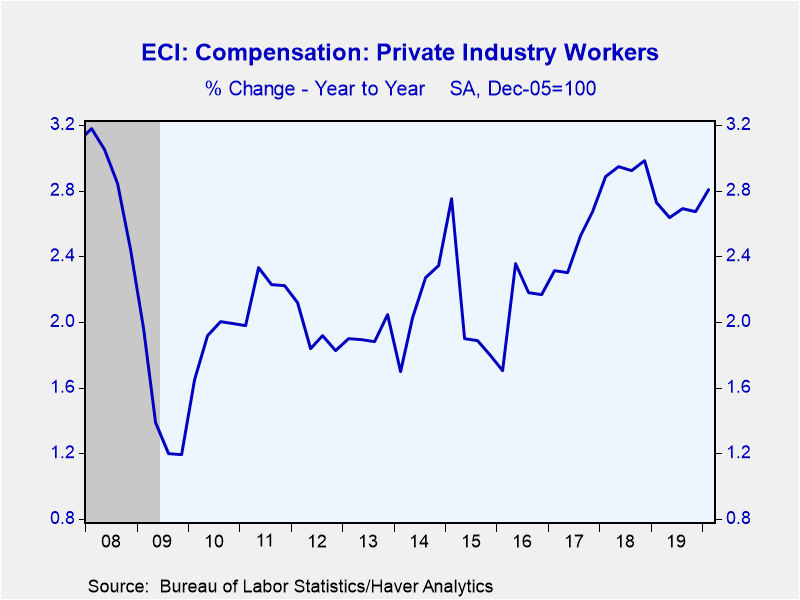
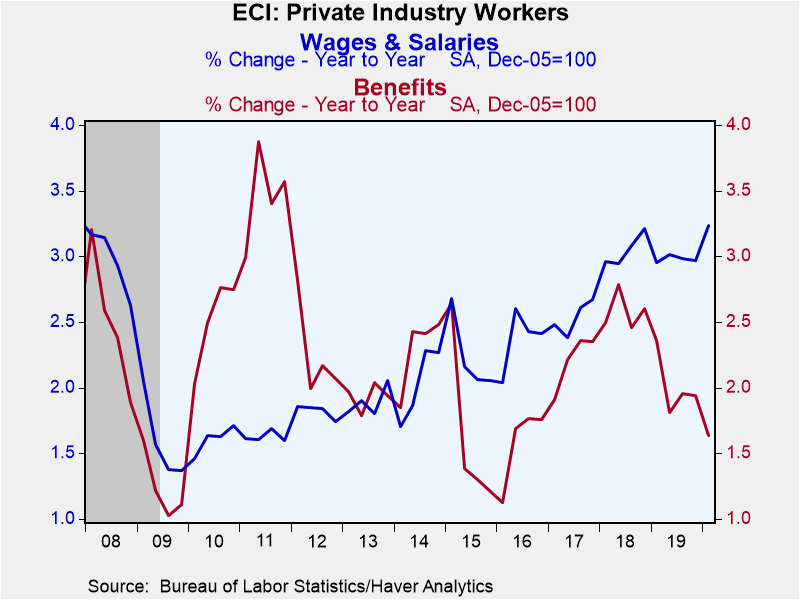
In the private sector, compensation also rose 0.8%, but this reflected a larger quarterly rise in wages and salaries than in the overall economy (1.0% q/q vs. 0.9%) and a larger slowdown in benefits (0.2% q/q vs. 0.4%). Compensation in goods-producing industries decelerated to 0.5% in Q1 from 0.7% in Q4 while compensation in service-providing industries picked up considerably to 0.9% in Q1 from 0.6% in Q4. The Q1 rise in service-sector compensation was the highest since 2007 Q3.
The employment cost index, which measures the change in the cost of labor, free from the influence of employment shifts among occupations and industries, is available in Haver's USECON database. Consensus estimates from the Action Economics survey are in Haver's AS1REPNA database.
Sandy Batten
AuthorMore in Author Profile »Sandy Batten has more than 30 years of experience analyzing industrial economies and financial markets and a wide range of experience across the financial services sector, government, and academia. Before joining Haver Analytics, Sandy was a Vice President and Senior Economist at Citibank; Senior Credit Market Analyst at CDC Investment Management, Managing Director at Bear Stearns, and Executive Director at JPMorgan. In 2008, Sandy was named the most accurate US forecaster by the National Association for Business Economics. He is a member of the New York Forecasters Club, NABE, and the American Economic Association. Prior to his time in the financial services sector, Sandy was a Research Officer at the Federal Reserve Bank of St. Louis, Senior Staff Economist on the President’s Council of Economic Advisors, Deputy Assistant Secretary for Economic Policy at the US Treasury, and Economist at the International Monetary Fund. Sandy has taught economics at St. Louis University, Denison University, and Muskingun College. He has published numerous peer-reviewed articles in a wide range of academic publications. He has a B.A. in economics from the University of Richmond and a M.A. and Ph.D. in economics from The Ohio State University.
More Economy in Brief
 Global| Feb 05 2026
Charts of the Week: Balanced Policy, Resilient Data and AI Narratives
by:Andrew Cates


