 Global| Aug 30 2010
Economic Sentiment In Europe Improves, But Pessimists Still In The Majority
Summary
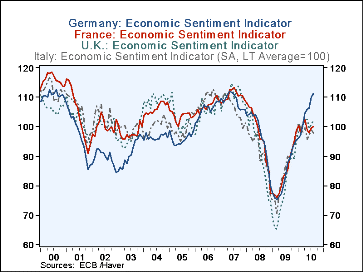
The European Commission's Economic Sentiment Indicator (ESI) for the twenty seven countries of the European Union increased in August to 102.7 from 102.0 in July and for the 16 countries of the Euro Area, to 101.8 from 101.1 in July. [...]
 The European Commission's Economic Sentiment Indicator (ESI) for the twenty seven countries of the European Union
increased in August to 102.7 from 102.0 in July and for the 16 countries of the Euro Area, to 101.8 from 101.1 in July.
The indicator is so constructed that its long term average (1990-2009) is equal to 100. At 102.7 and 101.8 both indicators
are slightly above their long term averages. Among some of the individual countries, Germany continues to shown increased
confidence as does the UK and to a lesser extent, France. Italy, on the other hand, showed a decline in confidence in
August as can be seen in the first chart.
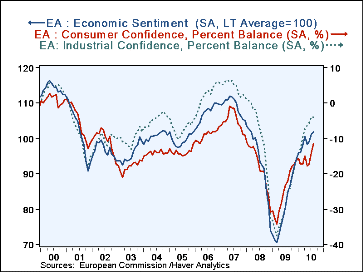
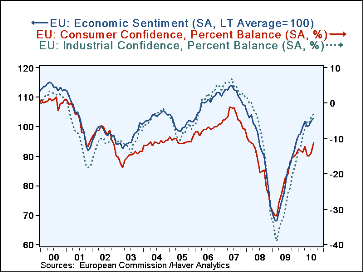
The ESI is based on the opinions of both business people and consumers. Some 130,000 executives and 40,000 consumers are polled by the EC in the first two weeks of each month. These opinions are expressed as the percent balance between positive and negative responses. These percent balances show, that while the overall indicator has improved, there is still a good deal of pessimism about the outlook. The improvement in both the industrial and consumer confidence measures has been in a less negative balance rather than an improvement in a positive balance. Thus for the EU, the balance in Consumer Confidence rose from -13.8% in July to -11.2% in August. And for the Euro Area, from -14.0% to -11.4%. The comparable data for Industrial Confidence, are for the EU, from-3.8% to -3.1% and for the Euro Area, from -4.0% to -3.9%. Although the number of pessimists is declining, they are still in the majority. The ESI, Industrial and Consumer Confidence for the Euro Area and the EU are shown in the second and third charts.
| Economic Sentiment Indicator (LT Avg=100) | Aug 10 | July 10 | Jun 10 | May 10 | April 10 | Mar 10 | Feb 10 | Jan 10 |
|---|---|---|---|---|---|---|---|---|
| Germany | 111.2 | 110.1 | 106.1 | 105.8 | 104.7 | 100.4 | 97.0 | 96.1 |
| France | 100.2 | 99.7 | 97.8 | 98.9 | 102.5 | 100.5 | 98.2 | 100.3 |
| UK | 102.3 | 100.8 | 99.4 | 102.4 | 101.7 | 100.9 | 98.3 | 98.2 |
| Italy | 98.0 | 98.9 | 97.2 | 95.8 | 99.7 | 98.2 | 99.7 | 101.4 |
| European Union (EU) | ||||||||
| ESI | 102.7 | 102.1 | 100.3 | 100.2 | 101.9 | 99.8 | 97.6 | 97.2 |
| Industrial Confidence (% Bal.) | -3.1 | -3.8 | -5.5 | -5.1 | -7.2 | -9.5 | -12.4 | -13.2 |
| Consumer Confidence | -11.7 | -13.8 | -14.9 | 15.0 | -12.3 | -13.9 | -13.8 | -13.4 |
| Euro Area (EA) | ||||||||
| ESI | 101.8 | 101.1 | 98.9 | 98.4 | 100.6 | 97.9 | 95.9 | 96.0 |
| Industrial Confidence (% Bal.) | -3.9 | -4.0 | -5.6 | -6.4 | -7.3 | -9.9 | -12.8 | -13.8 |
| Consumer Confidence | -11.4 | -14.0 | -17.3 | -17.8 | -15.0 | -17.3 | -17.4 | -15.8 |
More Economy in Brief
 Global| Feb 05 2026
Charts of the Week: Balanced Policy, Resilient Data and AI Narratives
by:Andrew Cates


