 Global| Apr 16 2009
E-Area IP Plunges
Summary
The chart above makes it clear that it is not the consumer sector that is leading IP lower in Europe. Capital goods and intermediate goods output are falling by 23% Year/Year compared to consumer goods output that is down by just [...]
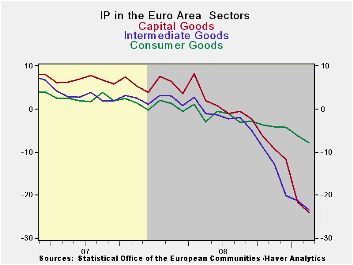
The chart above makes it clear that it is not the consumer
sector that is leading IP lower in Europe. Capital goods and
intermediate goods output are falling by 23% Year/Year compared to
consumer goods output that is down by just 7.7%. Over three months
capital goods output is declining at a 41% pace and intermediates goods
output is off at a 23% pace compared to minus 10% for consumer goods.
In the quarter to date the same sorts of caution hold sway as Q1 is
shaping up to be a terrible quarter for the industrial sector. Moreover
the rates of declines have sped up from 12-months to 6-months to three
months. Across countries German shows the a clear persisting pattern of
deceleration in industrial output. France and Spain see their growth
rates slowing the rate of decline over three months compared to six
months while Italy and the UK show flat growth rates in three months
compared to six months.
Still there is scant goods in the Area’s industrial sector
this month. The preference is in step with ongoing declines in
industrial output in the US extraordinary weakness in Japan and in
China; China has posted another drop in exports (fifth monthly drop in
a row) and registered its slowest growth rate in about a decade. The
pull back is global and it is still pulling back. It may be slowing but
not even that is clear.
| E-Area MFG IP | ||||||||||
|---|---|---|---|---|---|---|---|---|---|---|
| Saar except m/m | Mo/Mo | Feb 09 |
Jan 09 |
Feb 09 |
Jan 09 |
Feb 09 |
Jan 09 |
|||
| E-Area Detail | Feb 09 |
Jan 09 |
Dec 08 |
3Mo | 3Mo | 6mo | 6mo | 12mo | 12mo | Q-1 |
| MFG | -2.4% | -3.2% | -3.3% | -30.3% | -31.7% | -28.4% | -24.7% | -19.6% | -17.5% | -30.9% |
| Consumer | -1.6% | -0.8% | -0.3% | -10.4% | -7.4% | -9.2% | -6.9% | -7.7% | -6.2% | -9.6% |
| C-Durables | -4.3% | -1.8% | -2.5% | -29.4% | -28.8% | -28.5% | -21.3% | -21.2% | -16.9% | |
| C-Non-durables | -1.4% | -0.7% | -0.1% | -8.3% | -4.8% | -6.3% | -4.5% | -5.9% | -4.5% | |
| Intermediate | -2.4% | -1.0% | -6.4% | -32.9% | -37.3% | -34.0% | -30.6% | -23.4% | -21.3% | -32.0% |
| Capital | -3.0% | -7.0% | -2.9% | -41.0% | -41.5% | -35.8% | -30.4% | -23.9% | -21.5% | -43.3% |
| Main E-Area Countries and UK IP in MFG | ||||||||||
| Mo/Mo | Feb 09 |
Jan 09 |
Feb 09 |
Jan 09 |
Feb 09 |
Jan 09 |
||||
| MFG Only | Feb 09 |
Jan 09 |
Dec 08 |
3Mo | 3Mo | 6mo | 6mo | 12mo | 12mo | Q-2- Date |
| Germany: | -3.4% | -7.3% | -4.8% | -47.3% | -48.9% | -39.3% | -32.0% | -22.5% | -19.6% | -49.1% |
| France: IPxConstruct'n | -0.5% | -3.9% | -1.6% | -21.5% | -28.7% | -24.7% | -22.9% | -15.5% | -14.5% | -25.9% |
| Italy | -4.0% | -1.1% | -4.2% | -31.6% | -28.6% | -31.1% | -24.8% | -20.3% | -16.8% | -28.6% |
| Spain | 1.5% | -7.9% | 1.4% | -19.5% | -46.6% | -24.6% | -40.3% | -24.0% | -24.6% | -37.0% |
| UK: EU member | -0.9% | -3.0% | -1.9% | -20.7% | -27.4% | -20.4% | -20.2% | -13.8% | -13.0% | -24.2% |

Robert Brusca
AuthorMore in Author Profile »Robert A. Brusca is Chief Economist of Fact and Opinion Economics, a consulting firm he founded in Manhattan. He has been an economist on Wall Street for over 25 years. He has visited central banking and large institutional clients in over 30 countries in his career as an economist. Mr. Brusca was a Divisional Research Chief at the Federal Reserve Bank of NY (Chief of the International Financial markets Division), a Fed Watcher at Irving Trust and Chief Economist at Nikko Securities International. He is widely quoted and appears in various media. Mr. Brusca holds an MA and Ph.D. in economics from Michigan State University and a BA in Economics from the University of Michigan. His research pursues his strong interests in non aligned policy economics as well as international economics. FAO Economics’ research targets investors to assist them in making better investment decisions in stocks, bonds and in a variety of international assets. The company does not manage money and has no conflicts in giving economic advice.
More Economy in Brief


