 Global| Nov 25 2008
Dip in U.S. 3Q'08 GDP Revised Little; Profits Fell (Again)
by:Tom Moeller
|in:Economy in Brief
Summary
U.S. real GDP growth last quarter was little revised at -0.5% due to offsetting revisions to final demand growth (down) and inventories (up). The modest 0.5% (AR) decline compared to the advance report of a 0.3% dip and the revised [...]
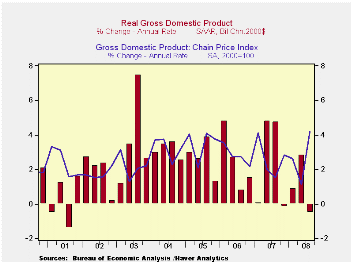
U.S. real GDP growth last quarter was little revised at -0.5% due to offsetting revisions to final demand growth (down) and inventories (up). The modest 0.5% (AR) decline compared to the advance report of a 0.3% dip and the revised figure matched Consensus expectations. Continuing its recent trend, the y/y rate of growth of 0.7% was the weakest since the end of the 2001 recession.
Released for the first time were corporate profits. They fell 1.0% and were down 9.0% y/y. Last quarter's decline compared to a 3.8% drop during 2Q and it was the seventh decline of the last eight quarters. The y/y decline was the weakest since the 2001 recession. The financial sector's travails continued to lead profits lower. Profits here fell 16.4% (-28.3% y/y) during 3Q. To some extent, cost cutting amongst domestic nonfinancial corporations offset that decline in financial sector earnings, but it wasn't by much. Profits in the domestic nonfinancial sector rose 6.1% during 3Q , but the weaker economy still left them down 4.8% versus last year. Finally, economic weakness lowered repatriated foreign sector earnings. They slipped 0.2% and were down for the third consecutive quarter. For the four quarters ending in 3Q, however, earnings were still positive, up 4.5%.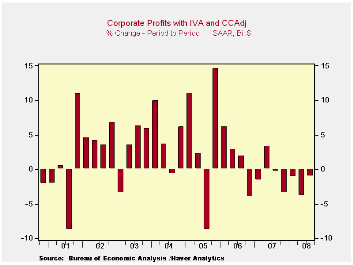
Residential construction fell again last quarter and the little revised 17.6% (-20.9% y/y) rate of decline subtracted 0.7% points from GDP growth.
 Business fixed investment was little changed at a -1.5% annual rate (+1.7% y/y), the first decline since the fourth quarter of 2006. It followed 2.5% growth during 2Q, a 4.9% rise during 2007 and roughly 7.5% growth in 2006 and 2005. Equipment investment repeated its 2Q performance and fell at a 5.6% rate (-2.6% y/y), the third consecutive quarter of decline. Conversely, structures investment was firm again and rose at a 6.6% annual rate (10.5% y/y).
Inventory accumulation added a somewhat greater 0.9 percentage points to GDP growth after three consecutive quarters of subtraction.
Business fixed investment was little changed at a -1.5% annual rate (+1.7% y/y), the first decline since the fourth quarter of 2006. It followed 2.5% growth during 2Q, a 4.9% rise during 2007 and roughly 7.5% growth in 2006 and 2005. Equipment investment repeated its 2Q performance and fell at a 5.6% rate (-2.6% y/y), the third consecutive quarter of decline. Conversely, structures investment was firm again and rose at a 6.6% annual rate (10.5% y/y).
Inventory accumulation added a somewhat greater 0.9 percentage points to GDP growth after three consecutive quarters of subtraction.
An improved foreign trade deficit added the same 1.1 percentage points to U.S. growth as estimated last month and it remained the main source of lift to GDP growth. The addition was, however, almost one third of that in 2Q. Exports grew at a slower 3.4% annual rate (6.2% y/y), half that in 2Q. Growth in imports weakened with the slowdown in overall economic growth. The 3.2% fall (-3.4% y/y) was the fifth quarterly decline in the last six.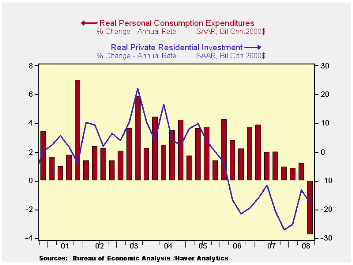
Spending by governments was strong again. The 5.3% rise (3.0% y/y) was little revised but the quickest since early 2003.
The GDP chain price index surged at an unrevised 4.2% annual rate. The accelerated rate of increase owed to a 5.2% jump in the PCE price index which was fueled by higher energy prices. Capital spending prices rose at an accelerated 4.3% rate (2.2% y/y) while the residential investment price deflator declined for the fourth straight quarter (-1.9% y/y).
The Federal Reserve Board on Tuesday announced the creation of the Term Asset-Backed Securities Loan Facility (TALF) and the announcement can be found here.
| Chained 2000$, % AR | 3Q '08 (Preliminary) | 3Q '08 (Advance) | 2Q '08 | 3Q Y/Y | 2007 | 2006 | 2005 |
|---|---|---|---|---|---|---|---|
| GDP | -0.5 | -0.3 | 2.8 | 0.7 | 2.0 | 2.8 | 2.9 |
| Inventory Effect | 0.9 | 0.6 | -1.5 | -0.4 | -0.4 | 0.0 | -0.2 |
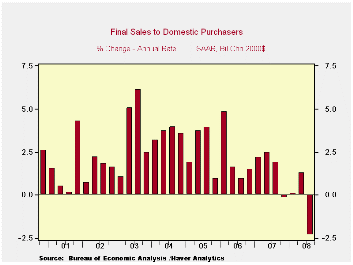
| Final Sales | -1.4 | -0.8 | 4.4 | 1.1 | 2.4 | 2.8 | 3.1 |
| Foreign Trade Effect | 1.1 | 1.1 | 2.9 | 1.4 | 0.6 | 0.2 | 0.0 |
| Domestic Final Demand | -2.3 | -1.8 | 1.3 | -0.3 | 1.8 | 2.6 | 3.1 |
| Chained GDP Price Index | 4.2 | 4.2 | 1.1 | 2.7 | 2.7 | 3.2 | 3.3 |

Tom Moeller
AuthorMore in Author Profile »Prior to joining Haver Analytics in 2000, Mr. Moeller worked as the Economist at Chancellor Capital Management from 1985 to 1999. There, he developed comprehensive economic forecasts and interpreted economic data for equity and fixed income portfolio managers. Also at Chancellor, Mr. Moeller worked as an equity analyst and was responsible for researching and rating companies in the economically sensitive automobile and housing industries for investment in Chancellor’s equity portfolio. Prior to joining Chancellor, Mr. Moeller was an Economist at Citibank from 1979 to 1984. He also analyzed pricing behavior in the metals industry for the Council on Wage and Price Stability in Washington, D.C. In 1999, Mr. Moeller received the award for most accurate forecast from the Forecasters' Club of New York. From 1990 to 1992 he was President of the New York Association for Business Economists. Mr. Moeller earned an M.B.A. in Finance from Fordham University, where he graduated in 1987. He holds a Bachelor of Arts in Economics from George Washington University.
More Economy in Brief


