 Global| Mar 21 2003
CPI Strong Due to Energy
by:Tom Moeller
|in:Economy in Brief
Summary
The Consumer Price Index (CPI-U) rose last month slightly more than Consensus expectations for a 0.5% gain. The 0.6% increase was the largest for one month since January 2001. The CPI less food and energy rose 0.1% (1.7% y/y). That [...]
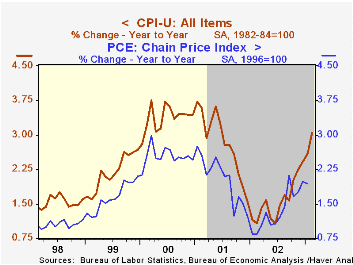
The Consumer Price Index (CPI-U) rose last month slightly more than Consensus expectations for a 0.5% gain. The 0.6% increase was the largest for one month since January 2001.
The CPI less food and energy rose 0.1% (1.7% y/y). That was the lowest y/y gain since early 1966. (This y/y change is based on not seasonally adjusted data and differs slightly from the change based on adjusted data.)
Energy prices were strong again last month. So far in 2003 energy prices have risen 10.2%. Last month's strength was led by a 9.9% (43.2% y/y) increase in gasoline prices. Gasoline prices so far in March have risen another 6.0%. Fuel and utility prices rose 2.0% (5.8% y/y) led by a 14.2% (39.1% y/y) gain in fuel oil prices. Piped gas & electricity prices rose 1.6% (4.7% y/y).
Core goods prices fell for the sixth consecutive month. Apparel prices fell 0.2%(-2.3% y/y). New and used vehicle prices fell 0.1% (-2.1% y/y). Prices for household furnishings and operation rose 0.2% (-0.7% y/y) for the second consecutive month.
The gain in core services prices moderated to 0.1% from 0.3% increases in the prior four months. Shelter prices were unchanged (2.7% y/y). Medical care services prices rose 0.2% (5.1% y/y) following a 0.1% January gain.Education and communication prices rose just 0.2% (2.3% y/y). Public transportation prices fell for the second consecutive month, down 0.4% (-1.8% y/y).
Food prices rose sharply led by strong gains in prices for cereals, meats and fruit.
The chained CPI which adjusts for shifts in consumer buying behavior rose 0.8%. It is similar to the PCE price deflator. The core price measure rose 0.3%, the most since August.
Analysis by the Federal Reserve Bank of Kansas City titled "Implications of Structural Change in the US Economy for Pricing Behavior and Inflation Dynamics" can be found here.
The Federal Reserve Bank of Richmond studies the Cyclical Behavior of Prices and Employee Compensation here.
| Consumer Price Index | Feb | Jan | Y/Y | 2002 | 2001 | 2000 |
|---|---|---|---|---|---|---|
| Total | 0.6% | 0.3% | 3.0% | 1.6% | 2.8% | 3.4% |
| Total less Food & Energy | 0.1% | 0.1% | 1.7% | 2.3% | 2.7% | 2.4% |
| Goods less Food & Energy | -0.1% | -0.3% | -1.5% | -1.1% | 0.3% | 0.5% |
| Services less Energy | 0.1% | 0.3% | 3.2% | 3.8% | 3.7% | 3.3% |
| Energy | 5.9% | 4.0% | 22.0% | -5.9% | 3.8% | 16.9% |
| Food & Beverages | 0.7% | -0.2% | 1.4% | 1.8% | 3.1% | 2.3% |
| Chained CPI: Total (NSA) | 0.8% | 0.4% | 2.8% | 1.2% | 2.1% | 2.0% |
| Total less Food & Energy | 0.3% | 0.2% | 1.5% | 1.7% | 1.9% | 1.4% |

Tom Moeller
AuthorMore in Author Profile »Prior to joining Haver Analytics in 2000, Mr. Moeller worked as the Economist at Chancellor Capital Management from 1985 to 1999. There, he developed comprehensive economic forecasts and interpreted economic data for equity and fixed income portfolio managers. Also at Chancellor, Mr. Moeller worked as an equity analyst and was responsible for researching and rating companies in the economically sensitive automobile and housing industries for investment in Chancellor’s equity portfolio. Prior to joining Chancellor, Mr. Moeller was an Economist at Citibank from 1979 to 1984. He also analyzed pricing behavior in the metals industry for the Council on Wage and Price Stability in Washington, D.C. In 1999, Mr. Moeller received the award for most accurate forecast from the Forecasters' Club of New York. From 1990 to 1992 he was President of the New York Association for Business Economists. Mr. Moeller earned an M.B.A. in Finance from Fordham University, where he graduated in 1987. He holds a Bachelor of Arts in Economics from George Washington University.
More Economy in Brief


