 Global| Oct 18 2006
CPI Fell 0.5%, Core Rose an Expected 0.2%
by:Tom Moeller
|in:Economy in Brief
Summary
The consumer price index (CPI-U) fell 0.5% last month due to sharply lower energy prices. The decline outpaced expectations for a 0.3% drop and was the largest m/m decline since last November. The 0.2% rise in prices less food & [...]
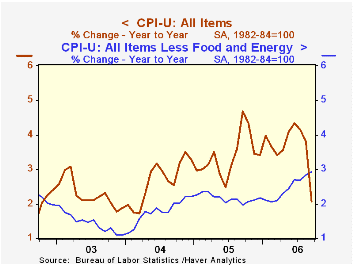
The consumer price index (CPI-U) fell 0.5% last month due to sharply lower energy prices. The decline outpaced expectations for a 0.3% drop and was the largest m/m decline since last November. The 0.2% rise in prices less food & energy was the third in a row and was as expected.
Energy prices were led 7.2% lower in September by a 13.5% drop in gasoline and a 4.9% (+0.5% y/y) fall in fuel oil prices. Gasoline prices have since fallen another 11.3% so far in October (-16.6% y/y) to an average $2.27 per gallon. Natural gas & electricity prices in September rose 1.2% (5.8% y/y).
Core goods prices fell 0.1% though apparel prices were strong and posted a 0.6% (0.9% y/y) gain after rising 0.9% in August. Appliance prices also rose a firm 0.7% (1.3% y/y) but furniture & bedding prices fell 0.7% (+1.4% y/y) while other equipment & furnishings prices dropped 1.9% (-6.5% y/y). New & used motor vehicle prices also slipped 0.3% (-0.1% y/y) and tobacco prices fell 0.1% (+2.1% y/y). Medical care commodity prices rose 0.2% (3.8% y/y).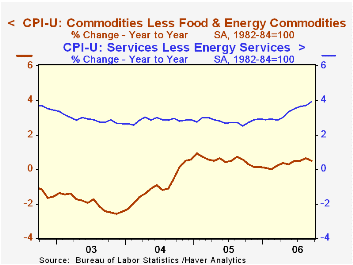
Core services prices rose 0.3% as shelter prices rose 0.3% (4.2% y/y). The rental equivalence measure of owners' primary residences rose 0.3% (4.0% y/y) for the second month and rents rose 0.4% (3.9% y/y) for the fourth straight month. Public transportation costs fell 0.7% (+3.9% y/y), the first m/m decline since March. Education costs rose 0.2% (6.1% y/y) and medical care services prices rose 0.4% (4.4% y/y) for the second month.
Food & beverage prices rose 0.4% as meat, fish & poultry prices increased 0.5% (1.6% y/y) and fruit & vegetable prices surged another 3.0% (7.3% y/y). Dairy prices were unchanged (-1.0% y/y).
The chained CPI, which adjusts for shifts in the mix of consumer purchases, fell 0.3% but less food & energy prices rose 0.3%.
The Quantity Theory of Money from the Federal Reserve Bank of St. Louis can be found here.
| Consumer Price Index | September | August | Y/Y | 2005 | 2004 | 2003 |
|---|---|---|---|---|---|---|
| Total | -0.5% | 0.2% | 2.1% | 3.4% | 2.7% | 2.3% |
| Total less Food & Energy | 0.2% | 0.2% | 2.9% | 2.2% | 1.8% | 1.5% |
| Goods less Food & Energy | -0.1% | 0.2% | 0.5% | 0.5% | -0.9% | -2.0% |
| Services less Energy | 0.3% | 0.2% | 3.9% | 2.8% | 2.8% | 2.9% |
| Energy | -7.2% | 0.3% | -4.5% | 16.9% | 10.8% | 12.2% |
| Food & Beverages | 0.4% | 0.3% | 2.6% | 2.4% | 3.4% | 2.1% |
| Chained CPI: Total (NSA) | -0.3% | 0.3% | 2.2% | 2.9% | 2.5% | 2.0% |
| Total less Food & Energy | 0.3% | 0.3% | 2.7% | 1.9% | 1.7% | 1.1% |
by Tom Moeller October 18, 2006
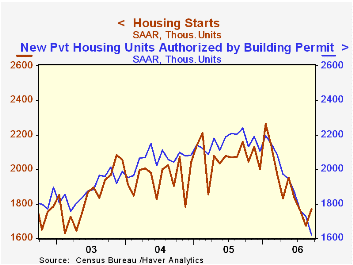
Housing starts in September rose for only the third month this year. The 5.9% increase to 1.772M units fully recovered all of the prior month's little revised 4.9% decline and easily beat Consensus expectations for a slight decline to 1.64M starts.
Starts nevertheless remained 21.8% below the peak this past January.
Single-family starts recovered 4.3% last month to 1.43M and recovered most of the prior month's 5.4% decline. Multi family starts were stronger and popped 12.7% after three consecutive months of sharp decline.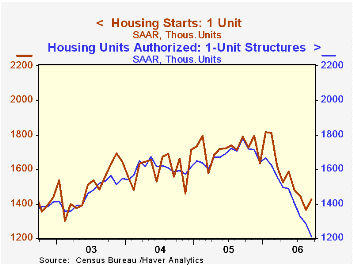
By region, single family housing starts rose everywhere except in the Northeast where starts fell 12.1% (-29.7% y/y). In the West single family starts inched up 0.9% m/m (-30.8% y/y) but in the South starts recovered 8.5% (-8.4% y/y). Single family starts in the Midwest also were higher by 3.9% (-33.0% y/y).
Building permits fell 6.3% to the lowest level since 2001. Permits to start singe family homes in addition fell hard by 6.0% (-32.1% y/y), also to the lowest since 2001.
How Resilient Is the Modern Economy to Energy Price Shocks? from the Federal Reserve Bank of Atlanta can be found here.
| Housing Starts (000s, AR) | September | August | Y/Y | 2005 | 2004 | 2003 |
|---|---|---|---|---|---|---|
| Total | 1,772 | 1,674 | -17.9% | 2,073 | 1,950 | 1,854 |
| Single-family | 1,426 | 1,367 | -20.3% | 1,719 | 1,604 | 1,505 |
| Multi-family | 346 | 307 | -6.0% | 354 | 345 | 349 |
| Building Permits | 1,619 | 1,727 | -27.7% | 2,159 | 2,058 | 1,888 |
by Tom Moeller October 18, 2006
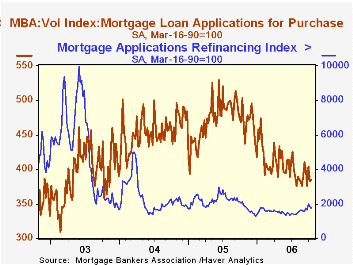
According to the Mortgage Bankers Association, the total number of mortgage applications fell 2.2% last week for the third decline in the last four weeks. Applications this month are just 0.5% higher than during September.
A 0.4% rise in purchase applications recovered just a piece of the prior week's 5.3% w/w skid and that left the level of purchase apps in early October 3.0% below the September average which rose 3.2% from August.
During the last ten years there has been a 58% correlation between the y/y change in purchase applications and the change in new plus existing single family home sales.
Applications to refinance about repeated the prior week's decline and fell 5.3%. Refis in October are 5.2% higher than the September average due to sharp increases late last month.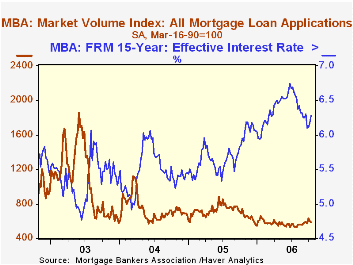
The effective interest rate on a conventional 30-year mortgage rose for the third consecutive week. The seven basis point increase to 6.56% left rates at the highest in a month. The peak for 30 year financing was 7.08% late in June. The rate for 15-year financing also rose ten basis points w/w to 6.28% versus 6.20% averaged last month. The peak rate was 6.75%. Interest rates on 15 and 30 year mortgages are closely correlated (>90%) with the rate on 10 year Treasury securities.
During the last ten years there has been a (negative) 79% correlation between the level of applications for purchase and the effective interest rate on a 30-year mortgage.
The Mortgage Bankers Association surveys between 20 to 35 of the top lenders in the U.S. housing industry to derive its refinance, purchase and market indexes. The weekly survey accounts for more than 40% of all applications processed each week by mortgage lenders. Visit the Mortgage Bankers Association site here.
The Federal Home Loan Bank System: The “Other” Housing GSE from the Federal Reserve Bank of Atlanta is available here.
| MBA Mortgage Applications (3/16/90=100) | 10/13/06 | 10/06/06 | Y/Y | 2005 | 2004 | 2003 |
|---|---|---|---|---|---|---|
| Total Market Index | 585.8 | 599.1 | -20.6% | 708.6 | 735.1 | 1,067.9 |
| Purchase | 384.7 | 383.7 | -23.7% | 470.9 | 454.5 | 395.1 |
| Refinancing | 1,758.2 | 1,857.0 | -16.1% | 2,092.3 | 2,366.8 | 4,981.8 |
by Carol Stone October 18, 2006

In July and August, the Euro-Zone region had its largest two-month trade deficit in the 17-plus-year history* of these combined regional data. In July, the deficit reached €6.2 billion and improved just slightly in August to €5.5 billion. These are tiny by US standards, but the more normal pattern in Europe is a trade surplus with the rest of the world, which just four years ago reached €8.2 billion.
July's deficit suffered from a decrease in exports of 2.0%, but these rebounded in August by 3.2%. They are a quite respectable 7.4% ahead of a year ago, a pace that has been equaled or exceeded in most months since the middle of 2003, when a two-and-a-half year recession ended in Germany. Manufactured goods led the way.
Imports rose 2.2% in July and 2.4% in August. August's inflows of merchandise were 10.3% ahead of a year ago. It is easy to say "oil is a major culprit", and it is, with the mineral fuel category up €3.7 billion, or 13.8%. However, manufactured goods are just as significant. "Other" manufactured goods" (excluding machinery and chemical products) are up €3.4 billion, or 14.5%. The European economy has been strong, and this is reflected in its demand for imported goods.
We title this article "Old News", since these data, of course, cover August. Since then, oil and gasoline prices have fallen dramatically. So we would hope that succeeding months' trade reports will look more favorable for oil importers.
*In this commentary we have used Haver's EUROSTAT database, which comes from Eurostat, and also our own summary compilation, G10+. Eurostat's seasonally adjusted data run back to 1989, hence our reference to the "17-year" history of the series. Eurostat's adjustment methods are called "TRAMO" and "SEATS", which take explicit account of "working days". In G10, Haver has run its own seasonal adjustment using the more familiar X-12 ARIMA technique. The series adjusted this way extend back to 1980, the same as the not seasonally adjusted data. Depending on your analytical needs, either or both of these datasets may be useful for your work.
| France, SA, Mil.€ | Aug 2006 | July 2006 | June 2006 | Aug 2005 | Monthly Averages|||
|---|---|---|---|---|---|---|---|
| 2005 | 2004 | 2003 | |||||
| Trade Balance | -5,454 | -6,262 | -1,324 | -1,695 | +1,658 | +5,958 | +5,797 |
| Exports | 114,739 | 111,138 | 113,460 | 107,329 | 103,191 | 96,068 | 88,199 |
| % Change | 3.2% | -2.0% | 0.8% | 7.4% | 7.4% | 8.9% | -2.3% |
| Imports | 120,193 | 117,361 | 114,783 | 109,004 | 101,533 | 90,110 | 82,402 |
| % Change | 2.4% | 2.2% | -0.0% | 10.3% | 12.7% | 9.4% | 0.5% |

Tom Moeller
AuthorMore in Author Profile »Prior to joining Haver Analytics in 2000, Mr. Moeller worked as the Economist at Chancellor Capital Management from 1985 to 1999. There, he developed comprehensive economic forecasts and interpreted economic data for equity and fixed income portfolio managers. Also at Chancellor, Mr. Moeller worked as an equity analyst and was responsible for researching and rating companies in the economically sensitive automobile and housing industries for investment in Chancellor’s equity portfolio. Prior to joining Chancellor, Mr. Moeller was an Economist at Citibank from 1979 to 1984. He also analyzed pricing behavior in the metals industry for the Council on Wage and Price Stability in Washington, D.C. In 1999, Mr. Moeller received the award for most accurate forecast from the Forecasters' Club of New York. From 1990 to 1992 he was President of the New York Association for Business Economists. Mr. Moeller earned an M.B.A. in Finance from Fordham University, where he graduated in 1987. He holds a Bachelor of Arts in Economics from George Washington University.
More Economy in Brief


