 Global| Dec 15 2005
CPI Decline Largest Since 1949; Core Inflation Steady
by:Tom Moeller
|in:Economy in Brief
Summary
The consumer price index (CPI-U) fell 0.6% last month, posting the largest m/m decline since a 0.8% drop in July of 1949. Sharply lower gasoline prices and tame "core" goods prices caused the figure to exceed Consensus expectations [...]
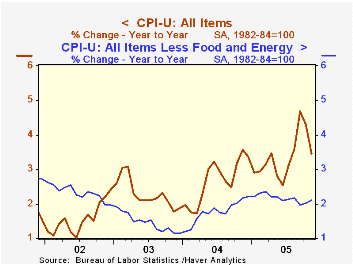
The consumer price index (CPI-U) fell 0.6% last month, posting the largest m/m decline since a 0.8% drop in July of 1949. Sharply lower gasoline prices and tame "core" goods prices caused the figure to exceed Consensus expectations for a 0.4% fall.
Prices less food & energy rose 0.2% in November and matched Consensus expectations. Core goods prices fell 0.1%, mostly due to a large 1.6% (NSA, -15.5% y/y) decline in computer & peripheral equipment prices. New & used vehicle prices also fell by 0.3% but it was due mostly to a 0.9% drop in used vehicle prices.
Pricing of many other goods was fairly firm. A 0.7% gain in furniture & bedding offset a 0.6% decline in appliance prices. Medical care commodity prices rose 0.6% (3.3% y/y) while educational books & supplies also rose 0.6% (5.4% y/y). Apparel prices rose 0.2% (-1.2% y/y) and tobacco prices rose 0.4% (6.1% y/y).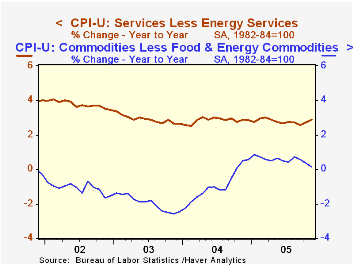
Core services prices increased 0.4% reflecting price gains of 0.6% (4.8% y/y) for medical care and 0.6% (6.2% y/y) for school tuition & fees. Shelter prices rose 0.3% (2.5% y/y) but public transportation prices were unchanged (5.9% y/y).
Energy prices fell 8.0% due to a 16.0% decline in gasoline prices to an average $2.26 per gallon (+16.1% y/y). Gasoline prices have fallen further in December to an average $2.17 while fuel oil prices also fell last month by 4.3% (+24.1% y/y. The bugger was a 2.1% rise in piped gas & electricity prices (19.8% y/y). A surprising 0.5% m/m decline (36.2% y/y) in natural gas prices will not likely be repeated given the rise in gas prices to record heights this month. Electricity prices rose 3.8% (11.3% y/y) in November.
The chained CPI which adjusts for shifts in the mix of consumer purchases fell 0.5% and less food & energy chain prices rose 0.3%.
Trend Inflation, Firm-Specific Capital, and Sticky Prices from the Federal Reserve Bank of Richmond can be found here.
| Consumer Price Index | Nov | Oct | Y/Y | 2004 | 2003 | 2002 |
|---|---|---|---|---|---|---|
| Total | -0.6% | 0.2% | 3.5% | 2.7% | 2.3% | 1.6% |
| Total less Food & Energy | 0.2% | 0.2% | 2.1% | 1.8% | 1.5% | 2.3% |
| Goods less Food & Energy | -0.1% | 0.0% | 0.1% | -0.9% | -2.0% | -1.1% |
| Services less Energy | 0.4% | 0.3% | 2.9% | 2.8% | 2.9% | 3.8% |
| Energy | -8.0% | -0.2% | 18.1% | 10.9% | 12.2% | -5.9% |
| Food | 0.3% | 0.3% | 2.2% | 3.4% | 2.1% | 1.8% |
| Chained CPI: Total (NSA) | -0.5% | 0.3% | 2.8% | 2.3% | 2.0% | 1.3% |
| Total less Food & Energy | 0.0% | 0.4% | 1.7% | 1.5% | 1.1% | 1.9% |

Tom Moeller
AuthorMore in Author Profile »Prior to joining Haver Analytics in 2000, Mr. Moeller worked as the Economist at Chancellor Capital Management from 1985 to 1999. There, he developed comprehensive economic forecasts and interpreted economic data for equity and fixed income portfolio managers. Also at Chancellor, Mr. Moeller worked as an equity analyst and was responsible for researching and rating companies in the economically sensitive automobile and housing industries for investment in Chancellor’s equity portfolio. Prior to joining Chancellor, Mr. Moeller was an Economist at Citibank from 1979 to 1984. He also analyzed pricing behavior in the metals industry for the Council on Wage and Price Stability in Washington, D.C. In 1999, Mr. Moeller received the award for most accurate forecast from the Forecasters' Club of New York. From 1990 to 1992 he was President of the New York Association for Business Economists. Mr. Moeller earned an M.B.A. in Finance from Fordham University, where he graduated in 1987. He holds a Bachelor of Arts in Economics from George Washington University.
More Economy in Brief


