 Global| May 14 2004
Consumer Prices Rose Less Than Forecast, But ...
by:Tom Moeller
|in:Economy in Brief
Summary
The Consumer Price Index (CPI-U) rose 0.2% in April versus Consensus expectations for a 0.3% gain. Core consumer prices, however, rose 0.3%, slightly more than Consensus expectations for a 0.2% rise. A surprising 0.3% m/m (11.0% y/y) [...]
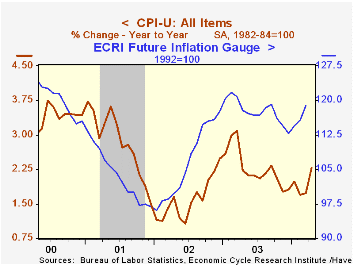
The Consumer Price Index (CPI-U) rose 0.2% in April versus Consensus expectations for a 0.3% gain. Core consumer prices, however, rose 0.3%, slightly more than Consensus expectations for a 0.2% rise.
A surprising 0.3% m/m (11.0% y/y) decline in seasonally adjusted gasoline prices held back the rise in overall energy prices to 0.1% (2.6% y/y). Not seasonally adjusted gasoline prices rose 3.7% and not seasonally adjusted energy prices rose 2.0%.
Prices of core consumer goods were unchanged, the weakness in part reflecting no change in apparel prices (0.2% y/y) following the 0.9% spike in March. Prices for home furnishings & operation slid 0.2% for the second consecutive month (-1.3% y/y) and new & used vehicle prices were also unchanged (-3.8% y/y). Medical care commodities prices jumped 0.4% (2.7% y/y).
Core service prices rose a firm 0.4% led by a 0.5% gain in shelter costs though prices for medical care services eased to 0.3% (5.4% y/y). Public transportation prices strengthened 0.4%(+2.1% y/y) and tuition costs rose 0.6% for the second consecutive month (7.4% y/y).
The chained CPI which adjusts for shifts in consumer buying behavior eased to just a 0.3% gain. It is similar to the PCE price deflator. The core chain price measure also eased to 0.2%, the weakest increase since January.
"The Historical and Recent Behavior of Goods and Services Inflation" from the Federal Reserve Bank of New York can be found here.
| Consumer Price Index | April | Mar | Y/Y | 2003 | 2002 | 2001 |
|---|---|---|---|---|---|---|
| Total | 0.2% | 0.5% | 2.3% | 2.3% | 1.6% | 2.8% |
| Total less Food & Energy | 0.3% | 0.4% | 1.8% | 1.5% | 2.3% | 2.7% |
| Goods less Food & Energy | 0.0% | 0.1% | -1.4% | -2.0% | -1.1% | 0.3% |
| Services less Energy | 0.4% | 0.5% | 3.1% | 2.9% | 3.8% | 3.7% |
| Energy | 0.1% | 1.9% | 5.5% | 12.2% | -5.8% | 3.7% |
| Food | 0.2% | 0.2% | 3.4% | 2.1% | 1.8% | 3.1% |
| Chained CPI: Total (NSA) | 0.3% | 0.6% | 1.9% | 1.9% | 1.3% | 2.3% |
| Total less Food & Energy | 0.2% | 0.7% | 1.3% | 1.1% | 1.9% | 2.0% |
by Tom Moeller May 14, 2004
Industrial production jumped 0.8% last month led by a surge in factory output. Consensus expectations had been for a 0.5% rise in total output.
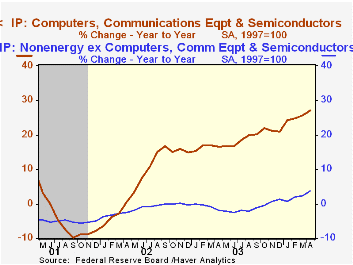
Production in the factory sector surged 0.7% (5.0% y/y) following a slight uptick in March. The gain was paced by more strength in the tech sector.
Output in selected high-technology industries rose 1.7% m/m (27.0% y/y). Output of computers & peripheral equipment surged 2.4% (24.1% y/y) and output of semiconductors & related equipment jumped 2.5% (46.6% y/y). Output of communications equipment fell 2.7% (-2.7% y/y), down for the third consecutive month.
Excluding high-tech factory output jumped 0.6% (+3.8% y/y). Machinery output added 0.6% (10.2% y/y) and electrical equipment output surged 2.0% (6.5% y/y). Output of motor vehicles & parts fell slightly (+8.5% y/y) and output of furniture jumped 1.2% (2.0% y/y). Non-durables output less energy was strong for the third month with a 0.6% (2.0% y/y) gain that was led by recently surging clothing output (+1.6% y/y).
Total capacity utilization rose to 76.9%. Growth in capacity remained low at 1.1% y/y.
| Production & Capacity | April | Mar | Y/Y | 2003 | 2002 | 2001 |
|---|---|---|---|---|---|---|
| Industrial Production | 0.8% | -0.1% | 4.8% | 0.3% | -0.6% | -3.4% |
| Capacity Utilization | 76.9% | 76.5% | 74.2%(4/03) | 74.8% | 75.6% | 77.4% |
by Tom Moeller May 14, 2004
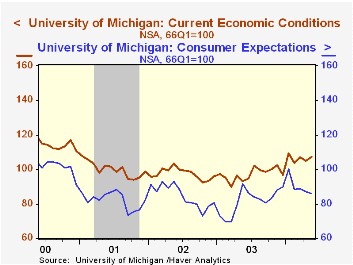
The University of Michigan’s Index of Consumer Sentiment was unchanged in mid-May from the April level at 94.2. Consensus expectations had been for a rise to 96.0.
During the last ten years there has been a 75% correlation between the level of consumer sentiment and the y/y change in real PCE. That correlation has risen to 82% during the last five years.
Perceptions of current economic conditions improved 2.1% to 107.2 and rose to the highest level since January. The expectations index fell for the second consecutive month by 1.7% to 85.8.
The University of Michigan survey is not seasonally adjusted.It is based on telephone interviews with 250 households nationwide on personal finances and business and buying conditions. The survey is expanded to a total of 500 interviews at month end.
| University of Michigan | Mid-May | April | Y/Y | 2003 | 2002 | 2001 |
|---|---|---|---|---|---|---|
| Consumer Sentiment | 94.2 | 94.2 | 2.3% | 87.6 | 89.6 | 89.2 |
| Current Conditions | 107.2 | 105.0 | 15.0% | 97.2 | 97.5 | 100.1 |
| Consumer Expectations | 85.8 | 87.3 | -6.1% | 81.4 | 84.6 | 82.3 |
by Tom Moeller May 14, 2004
The U.S. Government Budget improved in April, as it usually does, to a surplus of $17.6B. That was less than the expected improvement to a $25.0B surplus and was quite a bit less than last April's surplus of $51.1B. For the first seven months of FY04 the deficit of $281.8B was nearly 40% larger than last year.
So far this fiscal year the deficit is running about 5% of US GDP versus 3.5% last year and a peak of 6.0% in 1983. Adjusted for economic and other fluctuations, the standardized budget deficit is projected to hit 3.4% this year versus 2.8% last year and a peak of 4.8% in 1986.
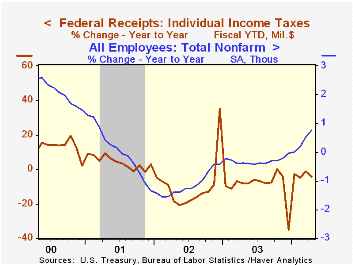
Growth in net receipts for the first seven months of FY04 dropped to 1.3% versus the first seven months of FY03. The drop from 3.1% growth last month reflected a slide in individual tax receipts of 4.5% (to $471.3B) versus the first seven months of FY02. Versus last April individual tax receipts were down 14.9%. Corporate tax receipts for the fiscal year-to-date were up 44.5% (at $90.8B) and in April were up 28.5%. Contributions for social insurance, estate taxes, and miscellaneous taxes rose.
Federal net expenditures surged 7.5% versus the first seven months of last fiscal year. Defense expenditures jumped 16.7% and Medicare outlays grew 8.9%. Interest expense fell 3.8% y/y.
| US Government Finance | April | Mar | April '03 | FY2003 | FY2002 | FY2001 |
|---|---|---|---|---|---|---|
| Budget Balance | $17.6B | $-72.7B | $51.1B | $-374.2B | $-157.8B | $127.3B |
| Revenues | $220.1B | $132.4B | -4.8% | -3.8% | -6.9% | -1.7% |
| Outlays | $202.5B | $205.1B | 12.4% | 7.2% | 7.9% | 4.2% |
by Tom Moeller May 14, 2004
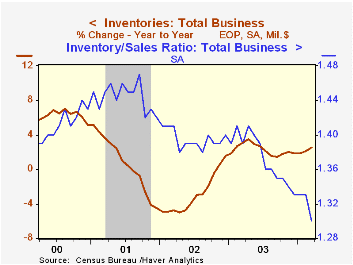
Total business inventories rose 0.7% in March for the seventh consecutive monthly increase. Consensus expectations were for a 0.5% increase.
Retail inventories rose a strong 1.1% in March that reflected a 1.9% (7.4% y/y) pop in auto inventories but also a 0.6% gain in non-auto inventories. The preliminary report of a 0.1% February rise in nonauto retail inventories was revised to 0.4%. What had been scattered inventory accumulation across retail sectors has broadened out.
Inventory additions lead production gains. During the last ten years there has been a 46% correlation between the three month change in business inventories and the three month change in US factory production. That correlation rises to 65% when the production gain is lagged three months.
Overall business sales jumped 2.9% (9.7% y/y) as factory shipments jumped 3.8% (9.2% y/y), wholesale sales rose 2.7% (12.0% y/y) and retail sales surged 2.1% (8.2% y/y).
The sales jump dropped the ratio of inventories-to-sales to a new record low of 1.30.
| Business Inventories | Mar | Feb | Y/Y | 2003 | 2002 | 2001 |
|---|---|---|---|---|---|---|
| Total | 0.7% | 0.8% | 2.6% | 1.9% | 1.5% | -4.5% |
| Retail | 1.1% | 0.7% | 4.5% | 4.9% | 6.0% | -2.8% |
| Retail excl. Autos | 0.6% | 0.4% | 3.1% | 3.0% | 2.6% | -1.1% |
| Wholesale | 0.6% | 1.2% | 3.8% | 2.2% | 0.4% | -4.5% |
| Manufacturing | 0.3% | 0.6% | -0.2% | -1.3% | -1.8% | -6.1% |

Tom Moeller
AuthorMore in Author Profile »Prior to joining Haver Analytics in 2000, Mr. Moeller worked as the Economist at Chancellor Capital Management from 1985 to 1999. There, he developed comprehensive economic forecasts and interpreted economic data for equity and fixed income portfolio managers. Also at Chancellor, Mr. Moeller worked as an equity analyst and was responsible for researching and rating companies in the economically sensitive automobile and housing industries for investment in Chancellor’s equity portfolio. Prior to joining Chancellor, Mr. Moeller was an Economist at Citibank from 1979 to 1984. He also analyzed pricing behavior in the metals industry for the Council on Wage and Price Stability in Washington, D.C. In 1999, Mr. Moeller received the award for most accurate forecast from the Forecasters' Club of New York. From 1990 to 1992 he was President of the New York Association for Business Economists. Mr. Moeller earned an M.B.A. in Finance from Fordham University, where he graduated in 1987. He holds a Bachelor of Arts in Economics from George Washington University.
More Economy in Brief


