 Global| Sep 16 2004
Consumer Price Inflation Under Wraps
by:Tom Moeller
|in:Economy in Brief
Summary
The Consumer Price Index (CPI-U) rose 0.1% last month, half the Consensus expectation. Less food and energy, the rise in the "core CPI also was half expectations and the third 0.1% gain in a row. Deflation in consumer goods prices [...]
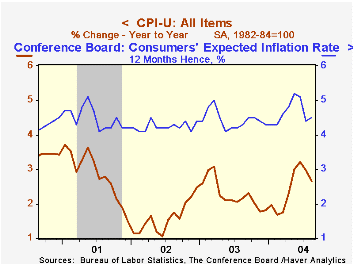
The Consumer Price Index (CPI-U) rose 0.1% last month, half the Consensus expectation. Less food and energy, the rise in the "core CPI also was half expectations and the third 0.1% gain in a row.
Deflation in consumer goods prices continued for the second month as indicated by a 0.1% decline in the CPI for "core" commodities. Household furnishings & operations prices fell for the second month, down 0.2% (-0.6% y/y), apparel prices ticked down 0.2% (-0.5% y/y) and new vehicle prices were off for the fifth month this year (-1.3% y/y).
Services price inflation also was under control, indicated by a 0.1% rise in prices less energy. Shelter prices rose just 0.1% (2.7% y/y), the 0.2% (5.1% y/y) increase in health care services was the weakest gain in over a year and education & communication prices rose a tepid 0.1% (1.5% y/y) that reversed a 0.1% decline in July.
Gasoline prices added to the July decline with a 1.4% (+16.6% y/y) drop, though fuel oil prices were strong with a 5.3% (20.4% y/y) gain.
The chained CPI, which adjusts for shifts in the mix of consumer purchases, was unchanged. It is similar to the PCE price deflator. The core chain price measure was unchanged; it has not risen since April.
From the Federal Reserve Bank of San Francisco is this report titled "Does a Fall in the Dollar Mean Higher Consumer Prices?" .
| Consumer Price Index | Aug | July | Y/Y | 2003 | 2002 | 2001 |
|---|---|---|---|---|---|---|
| Total | 0.1% | -0.1% | 2.7% | 2.3% | 1.6% | 2.8% |
| Total less Food & Energy | 0.1% | 0.1% | 1.7% | 1.5% | 2.3% | 2.7% |
| Goods less Food & Energy | -0.1% | -0.3% | -1.2% | -2.0% | -1.1% | 0.3% |
| Services less Energy | 0.1% | 0.3% | 2.9% | 2.9% | 3.8% | 3.7% |
| Energy | -0.3% | -1.9% | 10.6% | 12.2% | -5.8% | 3.7% |
| Food | 0.1% | 0.3% | 3.6% | 2.1% | 1.8% | 3.1% |
| Chained CPI: Total (NSA) | 0.0% | -0.1% | 2.1% | 1.9% | 1.3% | 2.3% |
| Total less Food & Energy | 0.0% | 0.0% | 1.2% | 1.1% | 1.9% | 2.0% |

Tom Moeller
AuthorMore in Author Profile »Prior to joining Haver Analytics in 2000, Mr. Moeller worked as the Economist at Chancellor Capital Management from 1985 to 1999. There, he developed comprehensive economic forecasts and interpreted economic data for equity and fixed income portfolio managers. Also at Chancellor, Mr. Moeller worked as an equity analyst and was responsible for researching and rating companies in the economically sensitive automobile and housing industries for investment in Chancellor’s equity portfolio. Prior to joining Chancellor, Mr. Moeller was an Economist at Citibank from 1979 to 1984. He also analyzed pricing behavior in the metals industry for the Council on Wage and Price Stability in Washington, D.C. In 1999, Mr. Moeller received the award for most accurate forecast from the Forecasters' Club of New York. From 1990 to 1992 he was President of the New York Association for Business Economists. Mr. Moeller earned an M.B.A. in Finance from Fordham University, where he graduated in 1987. He holds a Bachelor of Arts in Economics from George Washington University.
More Economy in Brief


