 Global| May 16 2003
Consumer Price Index Fell, Core Flat
by:Tom Moeller
|in:Economy in Brief
Summary
The Consumer Price Index (CPI-U) fell 0.3%, the first monthly decline since December 2001. Consensus expectations had been for a 0.1% decline. Lower energy prices led the overall CPI lower but prices for most goods also fell. The CPI [...]
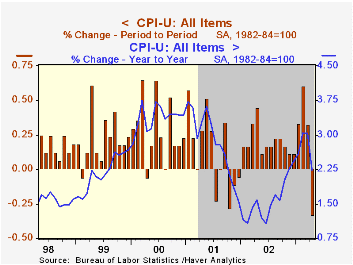
The Consumer Price Index (CPI-U) fell 0.3%, the first monthly decline since December 2001. Consensus expectations had been for a 0.1% decline. Lower energy prices led the overall CPI lower but prices for most goods also fell.
The CPI less food and energy was unchanged for the second month. That reading also was weaker than Consensus expectations for a 0.1% uptick.
Energy prices fell 4.6% in April and reversed the 4.6% gain the prior month. Gasoline prices fell 8.3% and so far in May are down another 5.5% versus April. Fuel oil prices fell 11.8% (28.4% y/y). Piped gas & electricity prices fell 0.5% (9.4% y/y).
Goods prices were down broadly last month, continuing a decline begun early in 2001. Core goods prices have fallen 2.7% since the March 2001 peak. Apparel prices fell 0.6%, down 10.9% since their peak in 1998. New and used vehicle prices fell 0.4%, down 4.2% since February 2001. Prices for household furnishings and operation fell 0.2% and are down 1.9% from the December 2001 peak. Even medical care commodities prices fell slightly last month.
Core services prices rose a slight 0.1% last month and are up at a 1.8% (AR) so far this year. Shelter prices rose 0.1% in April and 1.1% YTD (AR). Medical care services prices rose 0.3% and 1.9% YTD.Education and communication prices fell for the second consecutive month. Public transportation prices ticked 0.3% higher in April but are down 0.4% YTD.
The chained CPI which adjusts for shifts in consumer buying behavior fell 0.2%. It is similar to the PCE price deflator. The core price measure was unchanged.
Comments by Federal Reserve Board Governor Ben S. Bernanke on Deflation can be found here.
| Consumer Price Index | April | Mar | Y/Y | 2002 | 2001 | 2000 |
|---|---|---|---|---|---|---|
| Total | -0.3% | 0.3% | 2.2% | 1.6% | 2.8% | 3.4% |
| Total less Food & Energy | 0.0% | 0.0% | 1.5% | 2.3% | 2.7% | 2.4% |
| Goods less Food & Energy | -0.3% | -0.1% | -1.7% | -1.1% | 0.3% | 0.5% |
| Services less Energy | 0.1% | 0.0% | 2.8% | 3.8% | 3.7% | 3.3% |
| Energy | -4.6% | 4.6% | 12.8% | -5.8% | 3.7% | 16.9% |
| Food & Beverages | -0.1% | 0.2% | 1.2% | 1.8% | 3.1% | 2.3% |
| Chained CPI: Total (NSA) | -0.2% | 0.6% | 1.8% | 1.3% | 2.3% | 2.0% |
| Total less Food & Energy | 0.0% | 0.3% | 1.0% | 1.8% | 2.0% | 1.4% |
by Tom Moeller May 16, 2003
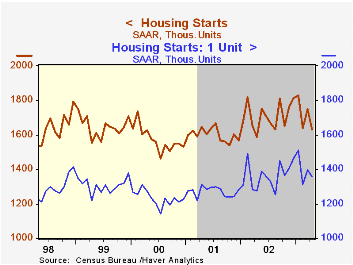
Housing starts were weaker than expected last month. Total starts fell 6.8% from March (revised slightly down) to 1.63 mil. Consensus expectations had been for starts of 1.73 mil. units. Figures back to 2001 were revised slightly.
Single family starts fell 3.0% m/m, reversing about half of the gain the prior month. So far this year single family starts are up 2.2% from the 2002 average.
Multi-family starts fell sharply last month, down 21.7%. Multi-family starts this year are down 8.4% versus 2002.
Building permits rose 1.2% last month but the gain just partially recovered a 5.5% March decline. Single family permits rose 1.2% in April and for 2003 so far are up 0.4% from last year.
An article by St. Louis Federal Reserve Bank President William Poole titled "Housing in the Macroeconomy" can be found here.
| Housing Starts (000s, AR) | April | Mar | Y/Y | 2002 | 2001 | 2000 |
|---|---|---|---|---|---|---|
| Total | 1,630 | 1,748 | 2.7% | 1,711 | 1,601 | 1,573 |
| Single Family | 1,356 | 1,398 | 6.4% | 1,364 | 1,272 | 1,232 |
| Multi Family | 274 | 350 | -12.2% | 347 | 330 | 341 |
| Building Permits | 1,708 | 1,688 | 2.8% | 1,750 | 1,637 | 1,598 |
by Tom Moeller May 16, 2003
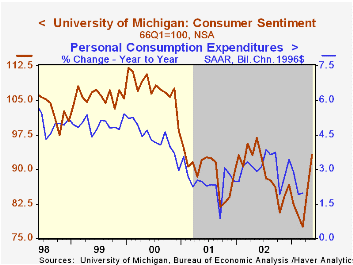
The preliminary May reading of Consumer Sentiment from the University of Michigan rose 8.4% versus April. The reading of 93.2 was firmer than Consensus expectations for 86.0 and added to a 10.8% jump in sentiment in last month.
The index of current conditions fell 2.4% and has been flat for most of the year. The index of expectations jumped another 16.9% back to the monthly high of last year.
Over the last ten years there has been a 64% correlation between the level of consumer sentiment and the y/y change in real PCE. The correlation over the last five years has been 83%.
The University of Michigan survey is not seasonally adjusted.It is based on telephone interviews with 250 households nationwide on personal finances and business and buying conditions. The survey is expanded to a total of 500 interviews at month end.
| University of Michigan | Mid-May | April | Y/Y | 2002 | 2001 | 2000 |
|---|---|---|---|---|---|---|
| Consumer Sentiment | 93.2 | 86.0 | -3.8% | 89.6 | 89.2 | 107.6 |

Tom Moeller
AuthorMore in Author Profile »Prior to joining Haver Analytics in 2000, Mr. Moeller worked as the Economist at Chancellor Capital Management from 1985 to 1999. There, he developed comprehensive economic forecasts and interpreted economic data for equity and fixed income portfolio managers. Also at Chancellor, Mr. Moeller worked as an equity analyst and was responsible for researching and rating companies in the economically sensitive automobile and housing industries for investment in Chancellor’s equity portfolio. Prior to joining Chancellor, Mr. Moeller was an Economist at Citibank from 1979 to 1984. He also analyzed pricing behavior in the metals industry for the Council on Wage and Price Stability in Washington, D.C. In 1999, Mr. Moeller received the award for most accurate forecast from the Forecasters' Club of New York. From 1990 to 1992 he was President of the New York Association for Business Economists. Mr. Moeller earned an M.B.A. in Finance from Fordham University, where he graduated in 1987. He holds a Bachelor of Arts in Economics from George Washington University.
More Economy in Brief


