 Global| Aug 26 2008
Consumer Confidence Up in August
by:Tom Moeller
|in:Economy in Brief
Summary
The Conference Board reported that consumer confidence rose a surprising 9.6% this month after a moderate 1.8% July gain. The rise contrasted with Consensus expectations for just a modest increase. The increase was fueled by a 23.7% [...]
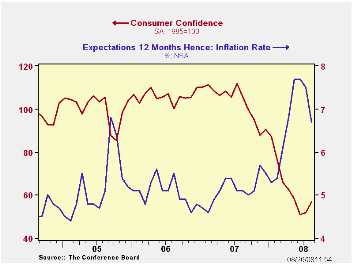
The Conference Board reported that consumer confidence rose a surprising 9.6% this month after a moderate 1.8% July gain. The rise contrasted with Consensus expectations for just a modest increase.
The increase was fueled by a 23.7% jump in the expectations component of the index which followed a moderate 3.1% July gain.
The percentage of respondents expecting business conditions to
worsen in six months dropped sharply and the percentage expecting fewer
jobs also fell to the lowest level since March. An improved 31.6% of
respondents planned to buy a major appliance within six months.
In contrast, the present conditions index fell slightly m/m to the lowest level since late 2003.
A slightly improved, but still negligible, 13.4% of respondents saw business conditions as good and that was near the lowest since early-2003. Jobs as plentiful were seen by a new low, since 2003, of 13.1% while 32.0% felt that jobs were hard to get. That was the highest since 2003.
Expectations for the inflation rate in twelve months fell again, last month to 6.7%.
Papers from last week's Economic Policy Symposium in Jackson Hole Wyoming are available here.
| Conference Board (SA, 1985=100) | August | July | Y/Y % | 2007 | 2006 | 2005 |
|---|---|---|---|---|---|---|
| Consumer Confidence Index | 56.9 | 51.9 | -46.1 | 103.4 | 105.9 | 100.3 |
| Present Situation | 63.2 | 65.8 | -51.4 | 128.8 | 130.2 | 116.1 |
| Expectations | 52.8 | 42.7 | -40.8 | 86.4 | 89.7 | 89.7 |
by Tom Moeller August 26, 2008
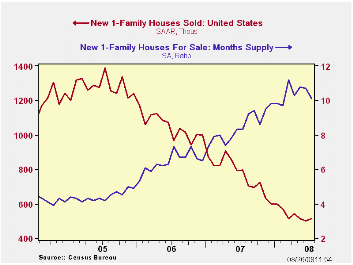
Sales new single-family homes in July rose 2.4% to 515,000. The increase, however, merely recovered a 2.1% fall during June which was deeper than estimated initially. The level of sales in July was down 62.9% from the July 2005 peak. The latest level of sales fell short of expectations for 525,000.
By region sales in the South repeated their June decline and
fell 2.5% and they are down 17.6% since December. In the Midwest the
pace of monthly declines accelerated to 8.2% and they are off 9.5% this
year. In the West sales rose 9.9% but that monthly increase still left
them off 9.6% so far this year. Though sales in the Northeast rose by
more than one-third they remained down 10.7% since December.
The median price for a new single-family home rose very
slightly for the second consecutive month to $230,700 but prices still
were off 6.3% y/y.
The number of new homes for sale again fell sharply, by 5.2% (-22.8% y/y). That reduced the inventory of unsold homes to the lowest level since late-2004. In each of the country's regions the inventory is down just short of one-quarter during the last year.
The month's supply of new homes for sale ticked lower m/m to 10.1 from an upwardly revised June level.
If Exchange Rates Are Random Walks, Then Almost Everything We Say About Monetary Policy Is Wrong from the Federal Reserve Bank of Minneapolis can be found here.
| US New Homes | July | June | Y/Y (%) | 2007 | 2006 | 2005 |
|---|---|---|---|---|---|---|
| Total Sales (SAAR, 000s) | 515 | 503 | -35.3 | 768 | 1,049 | 1,279 |
| Northeast | 50 | 36 | 4.2 | 64 | 64 | 81 |
| Midwest | 67 | 73 | -36.2 | 118 | 161 | 203 |
| South | 276 | 283 | -35.8 | 408 | 559 | 638 |
| West | 122 | 111 | -42.7 | 178 | 266 | 356 |
| Median Price (NSA, $) | 230,700 | 230,100 | -6.3 | 243,742 | 243,067 | 234,208 |
by Tom Moeller August 26, 2008
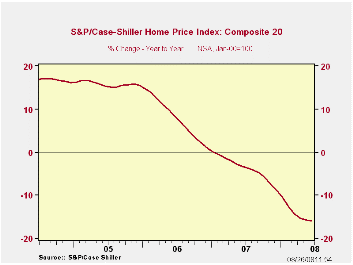
The S&P/Case-Shiller Composite 20 home price index during June fell 0.5% from May after a revised 0.9% drop during that month. Since the peak in July 2006 prices have fallen 18.8% and by 15.9% during the last twelve months. The series dates back only to 2000.
The Case-Shiller index of 20 U.S. cities and their surrounding
areas is weighted to reflect price changes due to extensive remodeling,
adding a home addition or extreme neglect. For example, smaller weights
are assigned to sales of homes that have undergone extensive remodeling.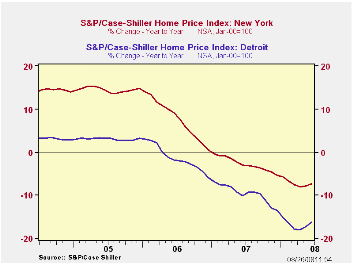
The Case-Shiller composite index of homes in 10 metropolitan areas, which has a longer history and dates back to 1987, fell 0.6% in June, down 17.0% year-to-year.
Home prices in Las Vegas, Nevada continued to fall and they were down 28.6% y/y. Prices in Miami also were off 28.3% and home prices in Los Angeles fell 25.3%. In San Diego prices fell 24.2% y/y and they were down 23.7% in San Francisco. Prices in Tampa Florida posted a 20.1% y/y decline.
In New York prices fell a lesser 7.3% and they were down 5.2% in Boston. In Dallas prices also were off a modest 3.2% and by only 1.0% in Charlotte, North Carolina. In Seattle Washington prices fell 7.1% and they were down 8.1% in Atlanta.
The S&P/Case-Shiller home price series can be found in Haver's USECON database but the city data is in the REGIONAL database.
The latest press release from Standard & Poor's can be found here.
An overview of the S&P/Case-Shiller home price series can be found here.
How Much Have U.S. House Prices Fallen? from the Federal Reserve Bank of St. Louis is available here.
| S&P/Case-Shiller Home Price Index (NSA, Jan 00 = 100) | June | May | Y/Y | 2007 | 2006 | 2005 |
|---|---|---|---|---|---|---|
| 20 City Composite Index | 167.69 | 168.54 | -15.9% | -3.8% | 7.6% | 15.8% |
by Tom Moeller August 26, 2008
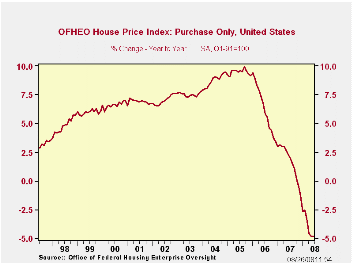
The index of U.S. house prices from the Office of Federal Housing Enterprise Oversight (OFHEO) was roughly unchanged in June and prices were down 4.8% from a year earlier.
The OFHEO price index reflects repeat sales of the same property. It does not, however, make an adjustment for changes in the form of additions to or deterioration of that property. During the latest twelve months OFHEO indicated that the
decline in home prices continued greatest in the Pacific region where
prices fell 16.4% y/y. That followed a 0.7% rise in prices last year
and several years of double digit gain.
During the latest twelve months OFHEO indicated that the
decline in home prices continued greatest in the Pacific region where
prices fell 16.4% y/y. That followed a 0.7% rise in prices last year
and several years of double digit gain.
Elsewhere in the country home prices fell one to five percent y/y except in the West South Central region where they rose 2.3%.
The latest report from OFHEO can be found here.
OFHEO figures are available in Haver's USECON database.
Treasury Bond Yields and Long-Run Inflation Expectations from the Federal Reserve Bank of San Francisco is available here.
| OFHEO House Price Index (Q1 1991=100, SA) | June | May | Y/Y | 2007 | 2006 | 2005 |
|---|---|---|---|---|---|---|
| Purchase Only | 213.8 | 213.9 | -4.8% | 1.7% | 6.3% | 9.5% |
by Tom Moeller August 26, 2008
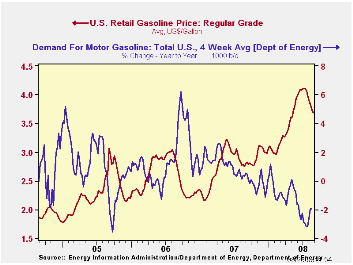
The pump price for a gallon of regular gasoline fell another six cents last week to $3.69 per gallon, according to the U.S. Department of Energy survey. The price has now fallen by 43 cents, or 10.4%, from the peak in early July. Nevertheless, gasoline prices still are one-third higher than last summer. For all grades of gasoline the average price fell six cents to $3.74 per gallon.
Yesterday the spot market price for a gallon of regular gasoline fell to $2.82 per gallon. That was versus last week's average of $2.86.
Weekly gasoline prices can be found in Haver's WEEKLY
database, daily prices are in the DAILY
database.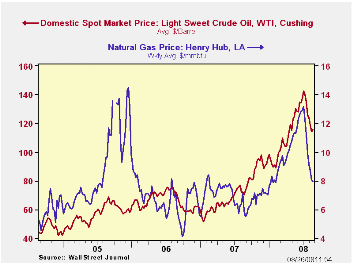
According to the U.S. Department of Energy, the demand for gasoline rose a slight 0.2% during the last four weeks but remained down 1.9% from a year earlier.
The DOE figures are available in Haver's OILWKLY database.
The price for a barrel of West Texas Intermediate crude oil ticked up last week to an average $115.60 per barrel. That's down from the high early last month of $142.46. The price was, however, still up by two-thirds from last summer.
Prices for natural gas fell again w/w to an average $7.93 per mmbtu (+33.6% y/y). The high for natural gas prices was in early-July at $13.19/mmbtu.
Fueling Expected Inflation from the Federal Reserve Bank of St. Louis can be found here.
| Weekly Prices | 08/25/08 | 08/18/08 | Y/Y | 2007 | 2006 | 2005 |
|---|---|---|---|---|---|---|
| Retail Regular Gasoline ($ per Gallon) | 3.69 | 3.74 | 34.0% | 2.80 | 2.57 | 2.27 |
| Light Sweet Crude Oil, WTI ($ per bbl.) | 115.60 | 114.45 | 64.5% | 72.25 | 66.12 | 56.60 |
by Tom Moeller August 26, 2008

According to the International Council of Shopping Centers, chain store sales ticked up 0.2% last week after the 0.1% rise during the week prior. So far in August sales are up 0.2% from the July average after that month's 0.5% rise.
During the last ten years there has been a 45% correlation between the y/y change in chain store sales and the change in nonauto retail sales less gasoline.The ICSC-UBS retail chain-store sales index is constructed using the same-store sales (stores open for one year) reported by 78 stores of seven retailers: Dayton Hudson, Federated, Kmart, May, J.C. Penney, Sears and Wal-Mart.
The leading indicator of chain store sales from ICSC-UBS increased 0.5% (-4.8% y/y) after having been unchanged during the week prior.
The chain store sales figures are available in Haver's SURVEYW database.
Monetary Policy in Uncertain Times (With a Salute to Julius Squeezer and Mr. Bean) are remarks made by Dallas Fed President Richard W. Fisher and they can be found here
| ICSC-UBS (SA, 1977=100) | 08/22/08 | 08/15/08 | Y/Y | 2007 | 2006 | 2005 |
|---|---|---|---|---|---|---|
| Total Weekly Chain Store Sales | 494.7 | 493.8 | 2.3% | 2.8% | 3.3% | 3.6% |
by Louise Curley August 26, 2008
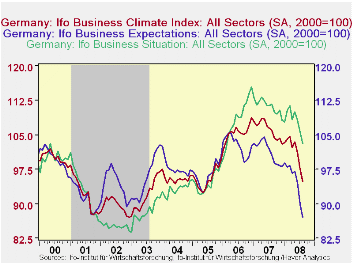
The IFO's measure of business confidence declined 2.8% in
August after declining 3.7% in July and 2.1% in June. The index is now
10.6% below a year ago and, at 94.8 (2000=100), the lowest level since
June, 2005.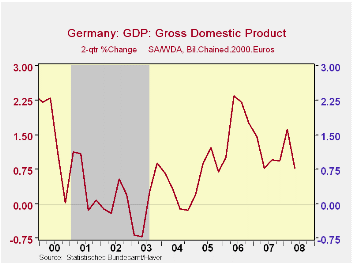
The overall measure is a combination of the views of the participants in the survey on the current situation and the outlook 6 months ahead. Views on the current situation have been in a down trend since December, 2006. Expectations weakened a few months earlier, but recovered to reach a peak of 108.6 in April, 2007. The subsequent rise in the price of oil and the strong euro began to dampen expectations and then the repercussions of the sub prime mortgage crisis began to be felt. The index for expectations is now at levels reached in the long recession of the early years of this decade as can be seen in the first chart showing the three indexes.
Also released today was the Federal Statistical Office's revised GDP for the second quarter.The 0.5% decline from the first quarter was confirmed but the first quarter growth was lowered to 1.3% from an unrevised 1.5%. While part of the decline might be attributed to the inability of the usual seasonal factors to deal with the extraordinarily mild winter, the percentage change in the two quarter average of this year is among the lowest of the past few years, as can be seen in the second chart. While the government still stands behind its forecasts of a 1.7% increase this year and 1.2% for 2009, private forecasters are beginning to lower their estimates.
| GERMANY | Aug 08 | Jul 08 | Aug 07 | M/M % chg | Y/Y % chg | 2007 | 2006 | 2005 | |
|---|---|---|---|---|---|---|---|---|---|
| IFO CONFIDENCE INDICATOR (2000=100) | |||||||||
| Business Climate | 94.8 | 97.5 | 106.0 | -2.77 | -10.57 | -- | 106.2 | 105.5 | 95.5 |
| Current Situation | 103.2 | 105.6 | 111.6 | -2.27 | -7.53 | -- | 111.2 | 108.4 | 94.7 |
| Expectations 6 Mo. Ahead | 87.0 | 89.9 | 100.6 | -3.23 | -13.52 | -- | 101.4 | 102.7 | 96.3 |
| GROSS DOMESTIC PRODUCT | Q2 08 | Q1 08 | Q4 07 | Q3 07 | Q2 07 | Q1 07 | 2007 | 2006 | 2005 |
| Q/Q % Change | -0.49 | 1.27 | 0.34 | 0.60 | 0.35 | 0.41 | 2.59 | 3.17 | 0.95 |
| 2Q average % Change | 0.77 | 1.61 | 0.94 | 0.95 | 0.76 | 1.47 | -- | -- | -- |

Tom Moeller
AuthorMore in Author Profile »Prior to joining Haver Analytics in 2000, Mr. Moeller worked as the Economist at Chancellor Capital Management from 1985 to 1999. There, he developed comprehensive economic forecasts and interpreted economic data for equity and fixed income portfolio managers. Also at Chancellor, Mr. Moeller worked as an equity analyst and was responsible for researching and rating companies in the economically sensitive automobile and housing industries for investment in Chancellor’s equity portfolio. Prior to joining Chancellor, Mr. Moeller was an Economist at Citibank from 1979 to 1984. He also analyzed pricing behavior in the metals industry for the Council on Wage and Price Stability in Washington, D.C. In 1999, Mr. Moeller received the award for most accurate forecast from the Forecasters' Club of New York. From 1990 to 1992 he was President of the New York Association for Business Economists. Mr. Moeller earned an M.B.A. in Finance from Fordham University, where he graduated in 1987. He holds a Bachelor of Arts in Economics from George Washington University.
More Economy in Brief


