 Global| May 31 2005
Consumer Confidence Rebounded
by:Tom Moeller
|in:Economy in Brief
Summary
The May Index of Consumer Confidence from the Conference Board rebounded much more than expected to 102.2. Confidence had fallen in each of the prior three months and Consensus expectations had been for another decline to 96.1. During [...]
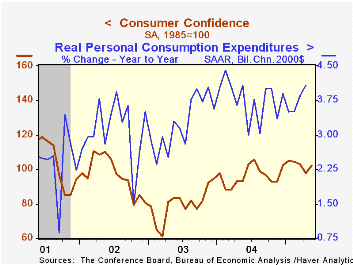
The May Index of Consumer Confidence from the Conference Board rebounded much more than expected to 102.2. Confidence had fallen in each of the prior three months and Consensus expectations had been for another decline to 96.1.
During the last twenty years there has been a 52% correlation between the level of consumer confidence and the y/y change in real consumer spending. The correlation rose to 66% during the last ten years.
Consumer expectations recovered nearly all of the prior month's sharp drop as expectations for jobs and business conditions rose.
The present situation index also recovered nearly all of the prior month's decline though jobs were viewed both as more plentiful and hard to get by a greater number of survey participants.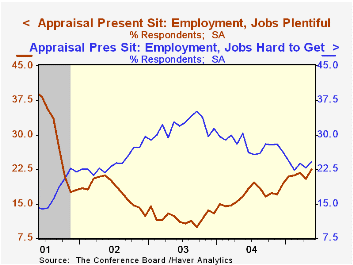
The Conference Board’s survey isconducted by a mailed questionnaire to 5,000 households and about 3,500 typically respond.
| Conference Board | May | April | Y/Y | 2004 | 2003 | 2002 |
|---|---|---|---|---|---|---|
| Consumer Confidence | 102.2 | 97.5 | 9.8% | 96.1 | 79.8 | 96.6 |
by Tom Moeller May 31, 2005
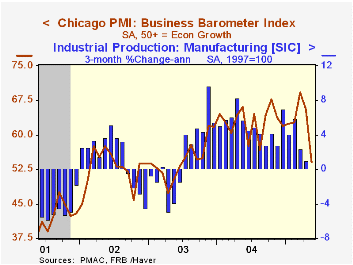
The Chicago Purchasing Managers Business Barometer fell sharply in May. The 11.5 point decline to 54.1 was the steepest drop since 1974, nearly matched the record for a one month decline and pulled the index to its lowest since June 2003. Consensus expectations had been for a more moderate drop to 62.0.
During the last ten years there has been a 65% correlation between the level of Chicago PMI and the three month change in factory sector industrial production.
New orders and production posted the sharpest declines of the component series and the employment index fell to the lowest level since January. During the last ten years there has been a 75% correlation between the level of the employment index and the three month change in factory sector employment.
The index of prices paid fell again to the lowest level since September 2003. During the last ten years there has been an 86% correlation between the Chicago price index and the three month change in the "core" intermediate goods PPI.
| Chicago Purchasing Managers Index, SA | May | April | May '04 | 2004 | 2003 | 2002 |
|---|---|---|---|---|---|---|
| Business Barometer | 54.1 | 65.6 | 66.1 | 62.9 | 54.6 | 52.8 |
| New Orders | 57.9 | 71.0 | 72.0 | 67.0 | 58.0 | 56.2 |
| Prices Paid | 54.3 | 66.1 | 79.5 | 80.1 | 55.8 | 56.9 |
by Louise Curley May 31, 2005

Both business and consumer confidence in the Euro Zone declined in May as shown in the first chart. Consumers have been more pessimistic than businesses since October 2002. The percent balance between those consumers who were optimistic and those who were pessimistic reached a low point of -21 in March 2003. After improving through the rest of 2003, the percent balance has ranged between -13 and -15. The percent balance was at the low end of this range in May. The high unemployment rate in the Euro zone may account for much of the pessimism of consumers. The rate has ranged narrowly between 8.8% and 8.9% for the past year and a half.
Business confidence as represented by the percent balance of respondents in the industrial sector who believe conditions will improve over those who believe conditions will worsen declined to -11 from -9 in April. Although business confidence has been stronger--in that it has been less negative--than that of consumers since October, 2002, it has since declined sharply--from -3 in November of last year to -11 in May, a level last seen in August 2003. Among the more commonly cited causes of the decline in business confidence are the high and rising oil prices and the rise in the value of the Euro that are shown in the second chart.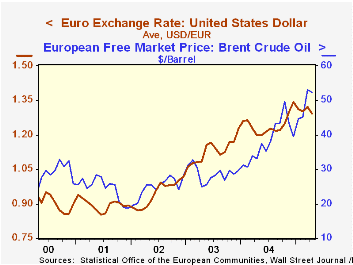
Business confidence has been affected adversely by rising oil prices and the rising value of the euro. The recent history of both of these factors are shown in the second chart.
| Euro Zone Confidence (Percent Balance) | May 05 | Apr 05 | May 04 | M/M dif | Y/Y dif | 2004 | 2003 | 2002 |
|---|---|---|---|---|---|---|---|---|
| Consumer | -15 | -13 | -15 | -2 | 0 | -14 | -18 | -11 |
| Business | -11 | *13 | -5 | -2 | -6 | -5 | -10 | -11 |
| Factors Affecting Business Confidence | Apr 05 | Mar 05 | Apr 04 | M/M % | Y/Y % | 2004 | 2003 | 2002 |
| Brent Crude $/bbl.) | 52.22 | 53.13 | 33.15 | -1.71 | 57.53 | 38.22 | 28.80 | 24.89 |
| Euro/US$ | 1.2957 | 1.2964 | 1.1947 | -1.99 | 7.95 | 1.3621 | 1.263 | 1.0487 |

Tom Moeller
AuthorMore in Author Profile »Prior to joining Haver Analytics in 2000, Mr. Moeller worked as the Economist at Chancellor Capital Management from 1985 to 1999. There, he developed comprehensive economic forecasts and interpreted economic data for equity and fixed income portfolio managers. Also at Chancellor, Mr. Moeller worked as an equity analyst and was responsible for researching and rating companies in the economically sensitive automobile and housing industries for investment in Chancellor’s equity portfolio. Prior to joining Chancellor, Mr. Moeller was an Economist at Citibank from 1979 to 1984. He also analyzed pricing behavior in the metals industry for the Council on Wage and Price Stability in Washington, D.C. In 1999, Mr. Moeller received the award for most accurate forecast from the Forecasters' Club of New York. From 1990 to 1992 he was President of the New York Association for Business Economists. Mr. Moeller earned an M.B.A. in Finance from Fordham University, where he graduated in 1987. He holds a Bachelor of Arts in Economics from George Washington University.
More Economy in Brief


