Global| Jul 25 2006
Consumer Confidence Improved Unexpectedly
by:Tom Moeller
|in:Economy in Brief
Summary
Consumer confidence as reported by the Conference Board rose 1.0% in July to 106.5 and added to a 0.7% June increase that was revised down slightly from the initial report. Consensus expectations had been for a decline in confidence [...]
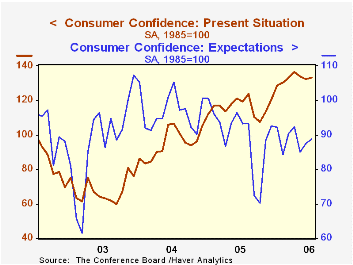
Consumer confidence as reported by the Conference Board rose 1.0% in July to 106.5 and added to a 0.7% June increase that was revised down slightly from the initial report. Consensus expectations had been for a decline in confidence to 104.0.
During the last twenty years there has been a 52% correlation between the level of consumer confidence and the y/y change in real consumer spending. The correlation rose to 66% during the last ten years.
The index measuring consumers' expectations rose 1.5% (-4.7% y/y). The rise mostly reflected less pessimism about the outlook for business conditions and jobs in six months rather than an outright rise in optimism about the outlook. 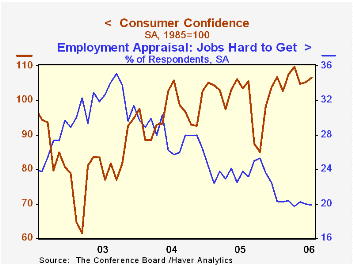
Expectations for the inflation rate in twelve months held steady at a reduced 5.1%.
Consumers' assessment of the present situation recovered half of the prior month's decline and rose 0.6% (11.5% y/y). The percentage of respondents who viewed business conditions as good (27.5%) rose and the percentage that viewed jobs as hard to get (19.9%) fell.
The Conference Board’s survey isconducted by a mailed questionnaire to 5,000 households and about 3,500 typically respond.
| Conference Board | July | June | Y/Y | 2005 | 2004 | 2003 |
|---|---|---|---|---|---|---|
| Consumer Confidence | 106.5 | 105.4 | 2.8% | 100.3 | 96.1 | 79.8 |
by Tom Moeller July 25, 2006
Texas Housing: A Boom With No Bubble? from the Federal Reserve Bank of Dallas is available here.
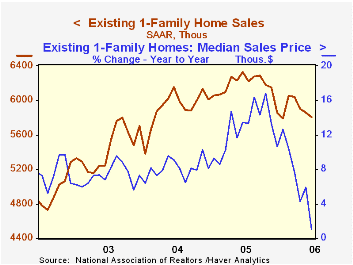
| Existing Home Sales (000, AR) | June | May | Y/Y | 2005 | 2004 | 2003 |
|---|---|---|---|---|---|---|
| Total Home Sales | 6,620 | 6,710 | -8.9% | 7,064 | 6,722 | 6,176 |
| Single Family Home Sales | 5,810 | 5,860 | -8.2% | 6,170 | 5,912 | 5,443 |
| Single Family Median Home Price (000) | $231.5 | $228.5 | 1.1% | $206.3 | $182.8 | $169.1 |
by Tom Moeller July 25, 2006
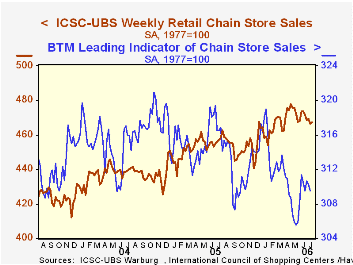
Weekly chain store sales edged up 0.2% last week but the rise failed to recover the prior week's 0.6% decline, according to the International Council of Shopping Centers (ICSC)-UBS survey.
Together with a similar 0.2% up tick in weekly sales early in the month, these modest increases did not recoup larger w/w declines at the end of June and in mid-July. As a result, sales this month are running 0.7% below the June average. Both the June & May average sales levels fell 0.4% from the prior month. During the last ten years there has been a 47% correlation between the y/y change in chain store sales and the change in nonauto retail sales less gasoline.The ICSC-UBS retail chain-store sales index is constructed using the same-store sales (stores open for one year) reported by 78 stores of seven retailers: Dayton Hudson, Federated, Kmart, May, J.C. Penney, Sears and Wal-Mart.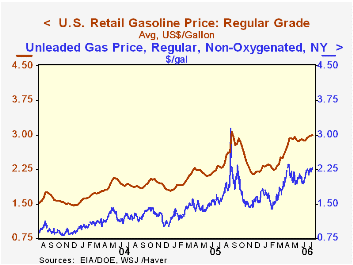
A continued gain yesterday in the spot market price of gasoline to $2.89 per gallon (45.3% y/y) portends further gains in retail gas prices.
| ICSC-UBS (SA, 1977=100) | 07/22/06 | 07/15/06 | Y/Y | 2005 | 2004 | 2003 |
|---|---|---|---|---|---|---|
| Total Weekly Chain Store Sales | 467.1 | 466.2 | 1.9% | 3.6% | 4.7% | 2.9% |
by Louise Curley July 25, 2006
Italy and the Netherlands reported today on surveys of business and consumer confidence and France reported on business confidence. Despite slight dips in consumer confidence in the Netherlands and in business confidence in Italy, confidence measures in these three countries show improving trends
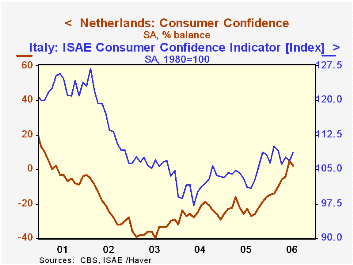
Consumers are still not very confident. In the Netherlands, the balance of optimists over pessimists dropped from 5% in June to 2% in July. What improvement that has taken place in the Netherlands has been due largely to a decline in the number of pessimists rather than an increase in optimists. In July 2005, the balance was -23%. Although there was an improvement in consumer confidence in Italy in July as the index of consumer confidence rose 1.7% from 89.5 (2000=100) in June to 91.0 in July, confidence continues well below the levels of 2000. (We have used the index function in the advanced functions to change the reported index base of 1980 to 2000) The first chart shows consumer confidence in Italy and the Netherlands.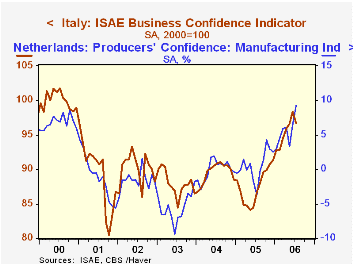
Business confidence, in contrast to that of consumers, has improved significantly over the past year. Although confidence in Italy dropped 1.6% in July from June, it was 11.5% above July, 2005. In the Netherlands, business confidence increased by 2.8 percentage points in July to 9.2% from 6.4% in June and was 12.9 percentage points above July, 2005. This is the highest percent balance on record and is above the recent peak of 8.2% in October, 2000. Measures of business confidence in Italy and the Netherlands are shown in the second chart.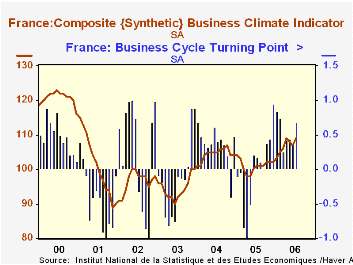
Business confidence also rose in France in July to 109 from 107 in June and from 101 in July, 2005. The French measure of business confidence is a composite of the balance of opinions on the following issues: production over the past three months, forecasts of production over the next three months, inventories, total order books, foreign order books and selling price expectations over the next three months. The indicator is constructed such that it has an average of 100 and a standard deviation of 10.
In addition to the business climate indicator INSEE (Institut Nationale de las Stastiques et des Etudes Economiques) also computes a qualitative indicator--Business Cycle Turning Point--that attempts to detect as soon as possible a turning point in the business cycle. The series tracks the difference between the probability that the economy is growing versus the probability that it is contracting. It is evaluated between -1 and +1. A value close to -1 suggests that the economy is contracting significantly; a value close to +1 suggests that the economy is expanding rapidly. A value close to 0 suggests that the economy is operating close to its long term growth rate. In July this indicator had a high value of .68, up from .36 in June and .17 in July, 2005. The Business Cycle Turning Point indicator and the Business Climate indicator are shown in the third chart.
| Measures of Confidence | Jul 06 | Jun 06 | Jul 05 | M/M Dif | Y/Y Dif | 2005 | 2004 | 2003 |
|---|---|---|---|---|---|---|---|---|
| The Netherlands | ||||||||
| Consumer % Balance | 2 | 5 | -23 | -3 | 25 | -22 | -25 | -35 |
| Business % Balance | 9.2 | 6.4 | -3.7 | 2.8 | 12.9 | 0.6 | -0.1 | -5.6 |
| Italy | ||||||||
| Consumer (2000=100) | 91.0 | 89.5 | 84.7 | 1.7* | 7.52* | 87.3 | 85.0 | 88.9 |
| Business (2000=100) | 96.7 | 98.3 | 86.7 | -1.6* | 11.5* | 87.5 | 89.5 | 88.0 |
| France | ||||||||
| Business Climate Indicator | 109 | 107 | 101 | 2 | 8 | 101 | 104 | 95 |
| Business Cycle Turning Point | 0.68 | 0.36 | 0.17 | 0.32 | 0.51 | -0.02 | 0.36 | -0.15 |

Tom Moeller
AuthorMore in Author Profile »Prior to joining Haver Analytics in 2000, Mr. Moeller worked as the Economist at Chancellor Capital Management from 1985 to 1999. There, he developed comprehensive economic forecasts and interpreted economic data for equity and fixed income portfolio managers. Also at Chancellor, Mr. Moeller worked as an equity analyst and was responsible for researching and rating companies in the economically sensitive automobile and housing industries for investment in Chancellor’s equity portfolio. Prior to joining Chancellor, Mr. Moeller was an Economist at Citibank from 1979 to 1984. He also analyzed pricing behavior in the metals industry for the Council on Wage and Price Stability in Washington, D.C. In 1999, Mr. Moeller received the award for most accurate forecast from the Forecasters' Club of New York. From 1990 to 1992 he was President of the New York Association for Business Economists. Mr. Moeller earned an M.B.A. in Finance from Fordham University, where he graduated in 1987. He holds a Bachelor of Arts in Economics from George Washington University.
More Economy in Brief
 Global| Mar 26 2026
Charts of the Week: A Supply-Constrained World Comes into Sharper Focus
by:Andrew Cates