 Global| Apr 22 2005
Construction Industry Jobs Lift Taiwan Employment; Unemployment Rate Sustains 4-Year Low
Summary
Employment in Taiwan increased by 2,000 in March, continuing a more moderate uptrend that emerged at the turn of the year; February saw a 17,000 rise and January 9,000. Most notably, manufacturing employment has declined the last two [...]
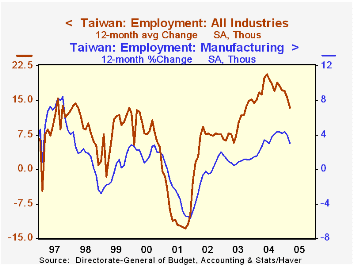
Employment in Taiwan increased by 2,000 in March, continuing a more moderate uptrend that emerged at the turn of the year; February saw a 17,000 rise and January 9,000. Most notably, manufacturing employment has declined the last two months. Other sectors, however, continue to expand, and the unemployment rate edged lower in March to 4.2%. In fact, during the last six months unemployment has hovered very near 4.2%, the lowest level since May 2001, during the world-wide recession associated with the technology "bust".
As seen in the graph, a feature of that recession was the typical cycle in manufacturing employment. But it was exacerbated by a sharp drop in construction industry employment as well. Taiwan is, of course, one of the Asian "NICs" -- newly industrializing countries. A building boom in the first half of the 1990s, which was probably associated with that status, was already slowing down, and the onset of the recession brought a sudden plunge in construction activity and jobs, evident in the second graph. But also seen there, over the last year or so, the construction sector has been on the rebound. Jobs have increased 70,000 since November 2003, a 10% gain. During that same period, service-sector jobs have risen just 2.7% and total employment is up 2.6%. 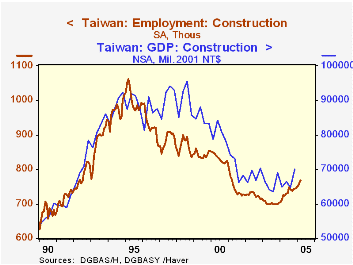
The February-March pause in manufacturing employment is perhaps only transitory, but it raises the question of whether the advance in the construction industry can continue if demand for Taiwan's final products is slowing enough to constrain job growth.
| Taiwan: Thousands, Seasonally Adjusted |
Mar 2005 | Feb 2005 | Mar 2004 | 2004 | 2003 | 2002 | 2001 |
|---|---|---|---|---|---|---|---|
| Total Industry Employment | 9,892 | 9,890 | 9,731 | 9,786 | 9,573 | 9,452 | 9,383 |
| Monthly Change | 2 | 17 | 12-Month Average Change | ||||
| 13 | 17 | 15 | 8 | -10 | |||
| Manufacturing | -8 | -5 | 7 | 9 | 3 | 4 | -13 |
| Construction | 10 | 8 | 4 | 4 | -1 | -1 | -8 |
| Service-Producing | 11 | 18 | 8 | 10 | 17 | 5 | 10 |
| Memo: Unemploy- ment Rate | Individual Months | Annual Average | |||||
| 4.2 | 4.3 | 4.5 | 4.4 | 5.0 | 5.2 | 4.6 | |
Carol Stone, CBE
AuthorMore in Author Profile »Carol Stone, CBE came to Haver Analytics in 2003 following more than 35 years as a financial market economist at major Wall Street financial institutions, most especially Merrill Lynch and Nomura Securities. She had broad experience in analysis and forecasting of flow-of-funds accounts, the federal budget and Federal Reserve operations. At Nomura Securities, among other duties, she developed various indicator forecasting tools and edited a daily global publication produced in London and New York for readers in Tokyo. At Haver Analytics, Carol was a member of the Research Department, aiding database managers with research and documentation efforts, as well as posting commentary on select economic reports. In addition, she conducted Ways-of-the-World, a blog on economic issues for an Episcopal-Church-affiliated website, The Geranium Farm. During her career, Carol served as an officer of the Money Marketeers and the Downtown Economists Club. She had a PhD from NYU's Stern School of Business. She lived in Brooklyn, New York, and had a weekend home on Long Island.
More Economy in Brief


