 Global| Mar 31 2008
Commodity Prices Surge
by:Tom Moeller
|in:Economy in Brief
Summary
Not only have petroleum prices and gold prices surged, but in their wake has been broad based strength in commodity prices. Industrial metals have remained strong recently despite the weakening of U.S. industrial sector activity. [...]
Not only have petroleum prices and gold prices surged, but in their wake has been broad based strength in commodity prices.
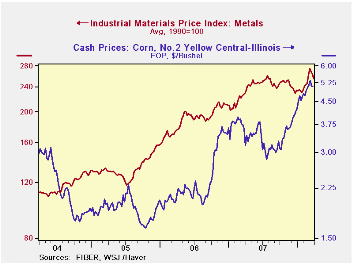
Industrial metals have remained strong recently despite the weakening of U.S. industrial sector activity. Continued strength in activity in the rest of the world accounts for the increase in metals prices. The table below indicates that aluminum prices are 10% above their 2007 average and they are 46% above 2005. Stainless steel scrap is up 6% from 2007 and more than double the 2005 average price. Prices for copper scrap round out the story of price strength and are 21% higher than last year and they are they are up one and a half times since 2005.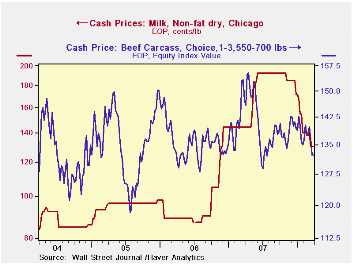
Food prices show less broad based strength. Beef prices generally have moved sideways during the last few years. Milk prices have been volatile. Recently a sharp decline offset what previously was a huge milk price gain and left prices up by nearly one third from the 2005 average. Grain prices are another story with corn prices up strongly in part due to demand for ethanol. Corn prices have nearly tripled the 2005 average and wheat prices similarly have surged.
Strength in oil prices comes from several sources that have nearly doubled crude costs since 2005. 1) Growth in U.S. demand for oil remains firm. It only recently turned slightly negative y/y. 2) Demand from the rest of the world, notably China, is firm. 3) Supply is questionable with the War in Iraq ongoing.
Then there's the price of gold which has nearly doubled since 2005 and touched $1,000 per ounce mostly due to global unrest.
Why hasn't all this commodity price strength shown up more in consumer prices? That's because processing and distribution costs of food account for most of the price consumers pay. Distribution & processing costs have gone up but not nearly as dramatically. The same is true for industrial materials prices, at least in the U.S. As for crude oil, the price gain has fed through and lifted gasoline prices by nearly 50% since 2005 (That's not to mention that gas prices have more than tripled since 1995.)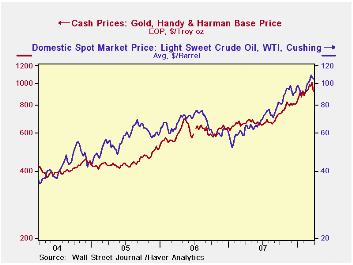
How does all this shake out? For a while the price strength caused slower than anticipated declines in U.S. interest rates. That has now changed as the Federal Reserve is reacting more to the weakening in economic activity. For U.S. inflation the price gains likely will add further upward pressure, especially since labor costs are rising as is economic liquidity. Will consumer price inflation, therefore, move much higher? A Consensus of economists says no. Weaker U.S. economic growth is expected to diffuse the price pressure and leave the GDP price index up just 2.2% this year and next, down from a 2.7% rise last year and 3.2% during the prior two years.
The commodity price series in the table below can be found in Haver's WEEKLY database
Current Events in the Economy and Financial Markets is last week's speech by Sandra Pianalto, President and CEO Federal Reserve Bank of Cleveland and it can be found here.
| Commodity Prices | Latest Week | February | January | February '07 | 2007 | 2006 | 2005 |
|---|---|---|---|---|---|---|---|
| Industrial Metals | |||||||
| Aluminum ($/ Metric Ton) | 1.30 | 1.23 | 1.10 | 1.26 | 1.18 | 1.18 | 0.89 |
| Stainless Steel Scrap ($/Ton) | 2,961 | 2,603 | 2,570 | 3,156 | 2,786 | 2,918 | 1,268 |
| Copper Scrap ($/lb) | 3.70 | 3.57 | 3.20 | 2.61 | 3.06 | 3.04 | 2.28 |
| Foods | |||||||
| Milk (Cents/lb.) | 130 | 140 | 158 | 145 | 173 | 98 | 95 |
| Beef Carcass (Index Value) | 133 | 138 | 139 | 139 | 141 | 136 | 136 |
| Corn ($/bushel) | 5.10 | 4.88 | 4.54 | 3.87 | 3.49 | 2.41 | 1.90 |
| Wheat ($/bushel) | 8.69 | 9.82 | 8.44 | 4.30 | 5.91 | 3.78 | 3.21 |
| Light Sweet Crude Oil, WTI ($/bbl.) | 104.2 | 94.9 | 93.4 | 58.5 | 72.2 | 66.1 | 56.6 |
| Gold, Handy & Harmon ($/oz.) | 926.8 | 1,006.8 | 916.4 | 884.0 | 810.5 | 628.7 | 507.4 |
by Louise Curley March 31, 2008
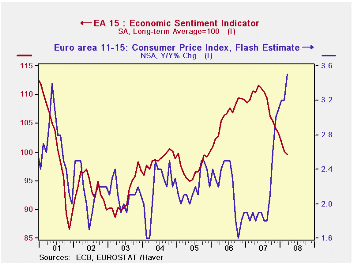
Inflation in the Euro Area continues to climb. The flash estimate for March was released today and reached 3.5%, up from 3.3% in February and the highest level since the creation of the Euro Area in January, 1999. Not surprisingly, business sentiment has been eroding as a result, not only of rising inflation but also the turmoil in financial markets. The Economic Sentiment Indicator for the entire area, also released today, fell to 99.6 in March, the first time it has been below its long term average of 100 since November, 2005. The first chart show inflation and confidence in the Euro Area.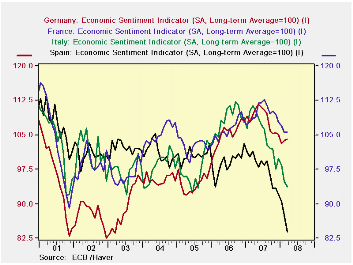
While sentiment for the entire area has declined, there has been considerable variation in the way sentiment has changed among the big four large countries--Germany, France, Italy and Spain. In Germany, confidence actually rose slightly--0.3%--to 104.0 in March. In France, it was unchanged at 105.6. In Italy, however, it was down 1.3% and in Spain, 4.1%, taking their respective levels to 93.7 and 83.9, well below their long term averages of 100. In year over year comparisons, sentiment in Germany was down 4.9% compared with only 2.8% for France. The big losses in sentiment were in Italy and Spain where the level of sentiment was 16% and 17%, respectively, below the year ago levels. Economic Sentiment Indicators for Germany, France, Italy and Spain are shown in the second chart.
| CONFIDENCE MEASURES | Mar 08 | Feb 08 | Mar 07 | M/M % Chg | Y/Y % Chg | 2007 | 2006 | 2005 |
|---|---|---|---|---|---|---|---|---|
| Euro Area: Inflation (Percent) | 3.5* | 3.3 | 1.9 | 0.2 | 1.6 | 2.14 | 2.18 | 2.19 |
| Euro Area: Economic Sentiment Indicator (Long term average =100) | ||||||||
| Total | 99.6 | 100.2 | 110.6 | -0.60 | -9.95 | 108.4 | 106.3 | 97.4 |
| Germany | 104.0 | 103.7 | 109.3 | 0.29 | -4.85 | 108.4 | 105.2 | 94.4 |
| France | 105.6 | 105.6 | 108.0 | 0.0 | -2.76 | 109.8 | 106.2 | 102.6 |
| Italy | 93.7 | 94.9 | 111.4 | -1.26 | -15.89 | 105.4 | 108.4 | 97.5 |
| Spain | 83.9 | 87.5 | 101.5 | -4.11 | -17.34 | 97.7 | 98.9 | 100.6 |
| *Flash Estimate (Changes are differences) |

Tom Moeller
AuthorMore in Author Profile »Prior to joining Haver Analytics in 2000, Mr. Moeller worked as the Economist at Chancellor Capital Management from 1985 to 1999. There, he developed comprehensive economic forecasts and interpreted economic data for equity and fixed income portfolio managers. Also at Chancellor, Mr. Moeller worked as an equity analyst and was responsible for researching and rating companies in the economically sensitive automobile and housing industries for investment in Chancellor’s equity portfolio. Prior to joining Chancellor, Mr. Moeller was an Economist at Citibank from 1979 to 1984. He also analyzed pricing behavior in the metals industry for the Council on Wage and Price Stability in Washington, D.C. In 1999, Mr. Moeller received the award for most accurate forecast from the Forecasters' Club of New York. From 1990 to 1992 he was President of the New York Association for Business Economists. Mr. Moeller earned an M.B.A. in Finance from Fordham University, where he graduated in 1987. He holds a Bachelor of Arts in Economics from George Washington University.
More Economy in Brief


