 Global| Aug 31 2004
Chicago Purchasing Agents' Index Down
by:Tom Moeller
|in:Economy in Brief
Summary
The Chicago Purchasing Managers Business Barometer for August fell hard to 57.3. The 11.4% m/m decline reversed nearly all of the 14.7% increase in July and left the index well off the May high of 68.0. Consensus expectations had been [...]
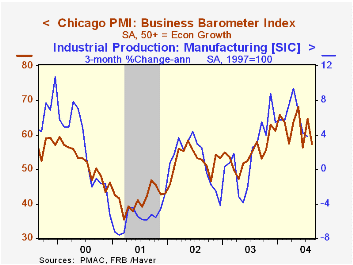
The Chicago Purchasing Managers Business Barometer for August fell hard to 57.3. The 11.4% m/m decline reversed nearly all of the 14.7% increase in July and left the index well off the May high of 68.0. Consensus expectations had been for a lesser decline to 60.0.
During the last ten years there has been a 73% correlation between the level of the Chicago Business Barometer and the three month change in factory sector industrial output. That correlation has risen to 85% during the last five years.
The new orders index slumped to 58.0 following the July advance to 68.7 from 56.8 in June. Production gave back half of its July gain with a drop to 61.8.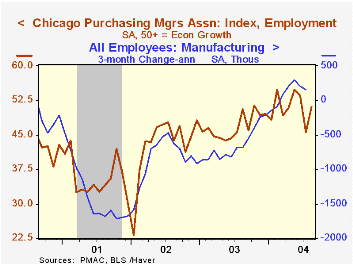
Bucking the other components, the employment index rose 5.5 points to 51.1. During the last twenty years there has been an 81% correlation between the level of this employment index and the three month change in factory sector employment.
The index of prices paid surged to 86.6, the highest level since 1988.
| Chicago Purchasing Managers Index, SA | Aug. | July | Aug. '03 | 2003 | 2002 | 2001 |
|---|---|---|---|---|---|---|
| Business Barometer | 57.3 | 64.7 | 57.9 | 54.7 | 52.7 | 41.4 |
| New Orders | 58.0 | 68.7 | 61.8 | 58.0 | 56.2 | 42.3 |
| Prices Paid | 86.6 | 77.6 | 51.7 | 55.8 | 56.9 | 50.4 |
by Tom Moeller August 31, 2004
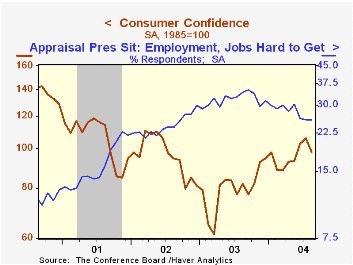
The Conference Board’s August Index of Consumer Confidence tumbled 7.1% to 98.2 following a downwardly revised 2.8% July gain. Consensus expectations had been for a more moderate decline to 103.0.
During the last twenty years there has been a 50% correlation between consumer confidence and the y/y change in real consumer spending.
The index of consumer expectations fell 8.3% (+1.8% y/y), reversing nearly all of the prior two months' strong gains. The present situation index also fell a sharp 5.4% (+62.4% y/y).
Jobs were viewed as hard to get by 25.8% of respondents versus 25.7% in July. The percentage of respondents expecting more jobs in six months fell to 16.2%, below 16.8% last year and 18.3% in 2002.
The Conference Board’s survey isconducted by a mailed questionnaire to 5,000 households and about 3,500 typically respond.
| Conference Board | August | July | Y/Y | 2003 | 2002 | 2001 |
|---|---|---|---|---|---|---|
| Consumer Confidence | 98.2 | 105.6 | 20.2% | 79.8 | 96.6 | 106.6 |
by Tom Moeller August 31, 2004
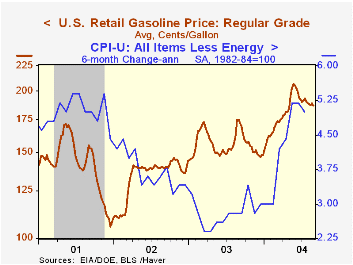
The average price for unleaded regular gasoline fell to $1.87 per gallon last week, down 9.6% from the May peak of $2.06.
Spot crude oil prices also fell. The price of West Texas Intermediate crude fell to $42.28 yesterday versus the mid-August high of $48.70 per barrel.
"A Crude Crude Oil Calculation" from the Federal Reserve Bank of St. Louis is available here.
Wholesale natural gas prices also eased to $5.05/mmbtu (+7.5% y/y) versus the May high of $6.68.
For the latest Short Term Energy Outlook from the US Department of Energy click here.
| Energy Prices | 08/30/04 | 12/31/03 | Y/Y | 2003 | 2002 | 2001 |
|---|---|---|---|---|---|---|
| US Retail Gasoline, Regular ($/Gal.) | $1.87 | $1.48 | 6.9% | $1.56 | $1.35 | $1.42 |
| Domestic Spot Market Price: West Texas Intermediate ($/Barrel) | $42.28 | $32.55 | 35.9% | $32.78 | $31.23 | $19.38 |
by Tom Moeller August 31, 2004
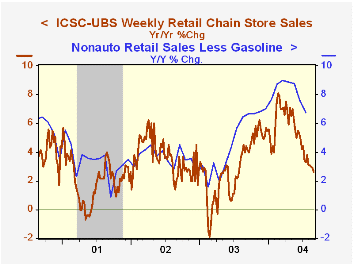
Chain store sales slipped 0.2% last week and gave back all of the paltry 0.1% rise the week prior according to the International Council of Shopping Centers (ICSC)-UBS.
For all of August, sales are even with the July average but are down 0.4% from the high in May.
During the last ten years there has been a 60% correlation between y/y change in chain store sales and the change in non-auto retail sales less gasoline.
The ICSC-UBS retail chain-store sales index is constructed using the same-store sales reported by 78 stores of seven retailers: Dayton Hudson, Federated, Kmart, May, J.C. Penney, Sears and Wal-Mart.
| ICSC-UBS (SA, 1977=100) | 08/28/04 | 08/21/04 | Y/Y | 2003 | 2002 | 2001 |
|---|---|---|---|---|---|---|
| Total Weekly Retail Chain Store Sales | 438.4 | 439.3 | 2.6% | 2.9% | 3.6% | 2.1% |

Tom Moeller
AuthorMore in Author Profile »Prior to joining Haver Analytics in 2000, Mr. Moeller worked as the Economist at Chancellor Capital Management from 1985 to 1999. There, he developed comprehensive economic forecasts and interpreted economic data for equity and fixed income portfolio managers. Also at Chancellor, Mr. Moeller worked as an equity analyst and was responsible for researching and rating companies in the economically sensitive automobile and housing industries for investment in Chancellor’s equity portfolio. Prior to joining Chancellor, Mr. Moeller was an Economist at Citibank from 1979 to 1984. He also analyzed pricing behavior in the metals industry for the Council on Wage and Price Stability in Washington, D.C. In 1999, Mr. Moeller received the award for most accurate forecast from the Forecasters' Club of New York. From 1990 to 1992 he was President of the New York Association for Business Economists. Mr. Moeller earned an M.B.A. in Finance from Fordham University, where he graduated in 1987. He holds a Bachelor of Arts in Economics from George Washington University.
More Economy in Brief


