 Global| Dec 22 2008
Chicago Fed Index Well Into Recession Territory
by:Tom Moeller
|in:Economy in Brief
Summary
The National Activity Index (CFNAI) from the Chicago Federal Reserve Bank for November continued on a downtrend and remained in recession territory. The latest reading of -2.47 followed a short-lived October bounce back from two [...]

The National Activity Index (CFNAI) from the Chicago Federal
Reserve Bank for November continued on a downtrend and remained in
recession territory. The latest reading of -2.47 followed a short-lived
October bounce back from two hurricanes. Since 1970 there has been a
75% correlation between the level of the index and the q/q change in
real GDP.
The three-month moving average of the index of -2.49 was at its lowest level since January of 1982.
An index level at or below -0.70 typically has indicated negative U.S. economic growth. A zero value of the CFNAI indicates that the economy is expanding at its historical trend rate of growth of roughly 3%.
The complete CFNAI report is available here and the historical data are available in Haver's SURVEYS database.
Each category of the index including employment, production, income, consumption & housing made a negative contribution to the November index.
The CFNAI is a weighted average of 85 indicators of economic activity. The indicators reflect activity in the following categories: production & income, the labor market, personal consumption & housing, manufacturing & trade sales, and inventories & orders.
In a separate survey, the Chicago Fed indicated that its Midwest manufacturing index fell during October to its lowest level since 1997. The auto sector continued to lead the weakness but the steel and machinery components also were weak.
| Chicago Fed | November | October | November '07 | 2007 | 2006 | 2005 |
|---|---|---|---|---|---|---|
| CFNAI | -2.47 | -1.27 | -0.44 | -0.40 | -0.01 | 0.28 |
| 3-Month Average | -2.49 | -2.40 | -0.49 | -- | -- | -- |
by Louise Curley December 22, 2008
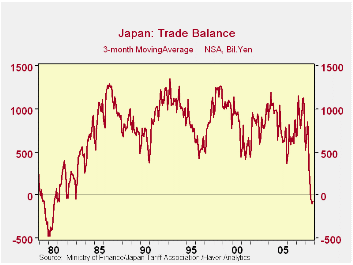
Japan announced today a 233 billion yen deficit in its foreign
trade for the month of November. Monthly deficits in foreign trade are
rare in Japan and this was the third deficit in the last four months.
On a three month moving average of the seasonally unadjusted data, the
results of the last few months are even more dramatic as can be seen in
the first chart. These deficits of recent months are the first to have
occurred since the late seventies and early eighties.
Exports were 27% below November 2008 due in part to the slowing of world demand and also to the rise in the yen. The rise in the yen over the past few months is compared with the performance of the dollar, the euro and the U.K. pound in the second chart. Between August 7 and December 19 (The recent low for the yen and the most recent), the broad trade weighted yen appreciated 32%, while the euro was virtually unchanged, the dollar was up 10% and the pound was down 18%. While a higher yen might ordinarily lead to higher imports, the current low level of the propensity to consume in Japan has actually resulted in a decline of 14% in imports from a year ago.
| JAPAN | Nov 08 | Oct 08 | Sep 08 | Aug 08 |
|---|---|---|---|---|
| Trade Balance Total (Bil Yen) | -233 | -68 | 86 | -332 |
| Trade Balance USA (Bil Yen) | -696 | -528 | -764 | -720 |
| Exports (Bil Yen) | 5327 | 6924 | 7364 | 7050 |
| Imports (Bil Yen) | 6660 | 6992 | 7278 | 7386 |
| Trade Weighted Exchange Rates (2000=100) | Aug 7 | Dec 18 | % Chg | - |
| US Dollar | 82.6 | 90.7 | 9.8 | - |
| Euro | 139.3 | 139.6 | 0.2 | - |
| UK Pound | 94.5 | 77.9 | -17.6 | - |
| Yen | 83.9 | 110.4 | 31.8 | - |
by Robert Brusca December 22, 2008
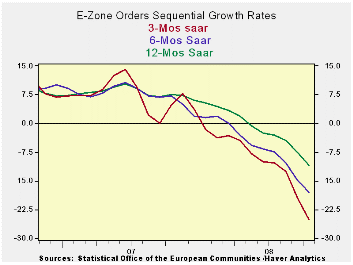
A rapid deceleration…The sharp drop in the growth rate for
orders in the current quarter is telling of the rapidity with which
this slowdown has struck Europe. Orders in the fourth quarter are
falling at annual rates of 50% in Germany, 57% in France, 37% in Italy
and nearly 70% in the United Kingdom. This obvious bespeaks of a sharp
slowing for growth in 2008-Q4.
Severe real sector hit… While the headlines have focused on
the financial sector and banking problems and, although German consumer
sentiment has been supported, the hit to EMU MFG has been severe. Both
the EMU MFG and Services PMIs have taken sharp drops. These barometers
precede the availability of authentic activity measures. The purchaser
type surveys are merely ‘indicators’ While variables such as industrial
output and retail sales are the actual results.
Orders are an actual forward-looking series… The orders series
is also an actual result and not simply an ‘indicator’. Orders, while
not actual activity are true figures corresponding to activity that
been contracted ahead. The orders data are available for October but
PMI data for December already are in hand –and they continue to be weak.
The recognition lag... It has taken some time but Germany
seems to have come around to the idea of more stimulus. The drop in the
HICP for the Zone (bringing the Yr/Yr headline pace to 2.1%) may also
free up the ECB to become less tentative. Both orders and sales are all
falling and orders are falling with uniform and shocking weakness
across EMU. The dramatic policy moves and in the US have been rekindles
euro FX strength. Is that a good sign or a signal how far behind Europe
is in adopting needed stimulus? There should be no question about the
severity of the weakness in Europe. It’s not just a banking problem.
| E-zone and UK Industrial Orders & Sales Trends | |||||||||
|---|---|---|---|---|---|---|---|---|---|
| Saar except m/m | % m/m | Oct 08 |
Oct 08 |
Oct 08 |
Oct 07 |
Oct 06 |
Qtr-2 Date |
||
| Ezone Detail | Oct 08 |
Sep 08 |
Aug 08 |
3-Mo | 6-mo | 12-mo | 12-mo | 12-mo | Saar |
| MFG Sales | -1.3% | -1.6% | -0.8% | -13.7% | -6.7% | -0.7% | 5.5% | 8.0% | -14.6% |
| Consumer | -0.2% | -0.3% | -0.2% | -2.8% | -2.2% | -1.1% | 5.5% | 8.0% | -2.9% |
| Capital | -0.4% | -0.5% | -0.4% | -5.0% | -4.1% | -0.5% | 3.9% | 4.6% | -4.9% |
| Intermediate | #N/A | -5.6% | -0.3% | #N/A | #N/A | #N/A | 7.3% | 8.0% | -15.6% |
| MFG Orders | |||||||||
| Total Orders | -4.7% | -5.4% | -1.6% | -38.1% | -26.1% | -14.4% | 8.8% | 10.9% | -42.1% |
| Countries: | Oct 08 |
Sep 08 |
Aug 08 |
3-Mo | 6-mo | 12-mo | 12-mo | 12-mo | Qtr-2 Date |
| Germany: | -6.8% | -8.0% | 3.1% | -38.9% | -29.1% | -16.4% | 10.8% | 9.1% | -50.2% |
| France: | -11.3% | 0.4% | -7.7% | -54.3% | -37.7% | -18.3% | 4.7% | 10.9% | -58.0% |
| Italy | -5.4% | -2.5% | -1.9% | -33.1% | -18.6% | -10.1% | 6.1% | 12.7% | -37.8% |
| UK(EU) | -28.3% | 28.7% | -8.6% | -49.5% | -42.4% | -14.2% | 5.0% | 9.2% | -69.9% |
by Robert Brusca December 22, 2008
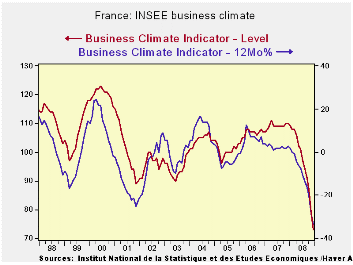
Business climate fell to 73 from 79 to a low since January of
1990 and tied for a life of series low last reached in June 1993 in
this 35 year series. The recent trend and likely trend responses are
also at their lowest since 2000. Order and foreign orders are now at
their lowest since 2000 but they are very weak, in the bottom 5% to 7%
of their respective ranges.
With this survey in hand INSEE now looks for France to suffer
a deeper recession than previously thought. Exports are diving and
plummeting sales now restrain and depress the manufacturing sector. The
euro zone's second-biggest economy would probably contract by 0.8
percent quarter-on-quarter in the final three months of 2008 after
growing just 0.1 percent between July and September, INSEE said in a
quarterly report. In Q1 2009 INSEE forecasts that the economy will
shrink by 0.4 percent and by 0.1 percent in the following quarter. In
its previous quarterly report, published in October, INSEE had
predicted a 0.1 percent decline in gross domestic product (GDP) in the
third and fourth quarters of 2008. Its view clearly has worsened.
Slowing global demand will continue to harm French exports, limiting
any advantage gained from recent softening in the euro, the statistics
office said (of course since this time the euro has strengthened
significantly making this point all the more forceful). INSEE said that
companies' efforts to run down surplus stocks are a further restraining
factor on manufacturing output, especially in the fourth quarter.
| INSEE Industry Survey | ||||||||||
|---|---|---|---|---|---|---|---|---|---|---|
| Since Jan 1990 | Since Jan 1990 | |||||||||
| Dec 08 |
Nov 08 |
Oct 08 |
Sep 08 |
%tile | Rank | Max | Min | Range | Mean | |
| Climate | 73 | 79 | 87 | 91 | 0.0 | 221 | 123 | 73 | 50 | 101 |
| Production | - | - | - | - | - | - | - | - | - | - |
| Recent Trend | -72 | -68 | -65 | -41 | 0.0 | 222 | 44 | -72 | 116 | -6 |
| Likely trend | -35 | -26 | -19 | -9 | 0.0 | 222 | 30 | -35 | 65 | 6 |
| Orders/Demand | ||||||||||
| Orders & Demand | -56 | -43 | -31 | -26 | 6.9 | 216 | 25 | -62 | 87 | -15 |
| Fgn Orders & Demand | -53 | -47 | -26 | -27 | 5.6 | 214 | 31 | -58 | 89 | -11 |
| Prices | ||||||||||
| Likely Sales Price Trend | -8 | -1 | 9 | 14 | 31.9 | 176 | 24 | -23 | 47 | 1 |

Tom Moeller
AuthorMore in Author Profile »Prior to joining Haver Analytics in 2000, Mr. Moeller worked as the Economist at Chancellor Capital Management from 1985 to 1999. There, he developed comprehensive economic forecasts and interpreted economic data for equity and fixed income portfolio managers. Also at Chancellor, Mr. Moeller worked as an equity analyst and was responsible for researching and rating companies in the economically sensitive automobile and housing industries for investment in Chancellor’s equity portfolio. Prior to joining Chancellor, Mr. Moeller was an Economist at Citibank from 1979 to 1984. He also analyzed pricing behavior in the metals industry for the Council on Wage and Price Stability in Washington, D.C. In 1999, Mr. Moeller received the award for most accurate forecast from the Forecasters' Club of New York. From 1990 to 1992 he was President of the New York Association for Business Economists. Mr. Moeller earned an M.B.A. in Finance from Fordham University, where he graduated in 1987. He holds a Bachelor of Arts in Economics from George Washington University.
More Economy in Brief


