 Global| Nov 24 2008
Chicago Fed Index Rose After Hurricanes
by:Tom Moeller
|in:Economy in Brief
Summary
The October National Activity Index (CFNAI) from the Chicago Federal Reserve Bank improved last month after Hurricanes depressed economic activity during September. The index, however, remained in recession territory. The latest [...]
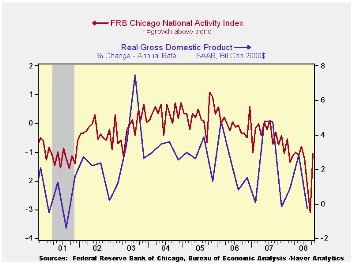
The October National Activity Index (CFNAI) from the Chicago Federal Reserve Bank improved last month after Hurricanes depressed economic activity during September. The index, however, remained in recession territory. The latest reading of -1.06 roughly equaled the averages of the first and second quarters of this year but improved from the third quarter average of -2.15.Since 1970 there has been a 75% correlation between the level of the index and the q/q change in real GDP.
The three-month moving average of the index held roughly steady at -2.09. The latest was near its lowest since the last recession, early in 1991.
An index level at or below -0.70 typically has indicated negative U.S. economic growth. A zero value of the CFNAI indicates that the economy is expanding at its historical trend rate of growth of roughly 3%. During the last twenty years there has been a 68% correlation between the level of the CFNAI and q/q growth in real GDP.
The complete CFNAI report is available here and the historical data are available in Haver's SURVEYS database.
The production category made a positive contribution to the October index as it recovered from a depressed level the month earlier. Conversely the income, housing, consumption and employment categories had a negative influence on the total.
The CFNAI is a weighted average of 85 indicators of economic activity. The indicators reflect activity in the following categories: production & income, the labor market, personal consumption & housing, manufacturing & trade sales, and inventories & orders.
In a separate survey, the Chicago Fed indicated that its Midwest manufacturing index fell during September to its lowest level since 2003. The auto sector continued to lead the weakness but the steel, machinery and resource sector components also were weak.
The Joint Statement by Treasury, Federal Reserve, and the FDIC on Citigroup can be found here.
| Chicago Fed | October | September | October '07 | 2007 | 2006 | 2005 |
|---|---|---|---|---|---|---|
| CFNAI | -1.06 | -3.11 | -0.75 | -0.41 | -0.02 | 0.28 |
| 3-Month Average | -2.09 | -2.16 | -0.59 | -- | -- | -- |
by Tom Moeller November 24, 2008
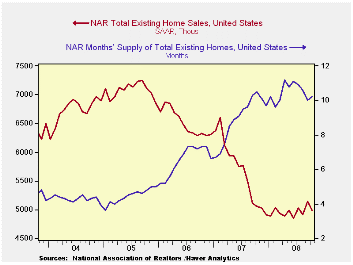
During October, U.S. existing home sales reversed most of the prior month's rise and fell 3.1% to 4.980 million, according to the National Association of Realtors. The 3.1% decline followed a revised 4.7% September increase and it was slightly greater than Consensus expectations for which were for a selling rate of 5.00M homes. Total sales include sales of condos and co-ops.
The month-to-month volatility in home sales this year has been near a roughly stable trend line at the 5.0 million unit level, down 11.8% from last year's average.
Median home prices fell 4.2% (NSA) during
October for the fourth consecutive monthly drop. That pulled the y/y
comparison to -11.3%. Prices have fallen 20.0% since their peak in June
2007.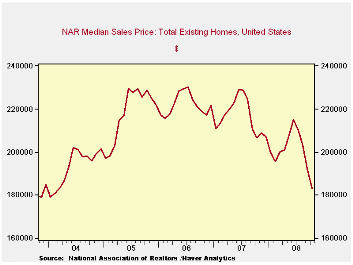
Sales of existing single-family homes followed a similar pattern as the total and fell 3.3% after a revised 5.3% rise during September. Sales of existing homes are down by one-third from their peak in mid-2005.
By region, home sales in the Midwest led last month's decline with a 6.0% drop and they were down nearly ten percent from last year. In the South sales fell 2.2% m/m (-10.2% y/y). In the West sales slipped 1.6%, however, they were up one-third from last October. Sales in the Northeast fell 1.2% and they were off 17.7% from last year's average.
The number of unsold homes (condos & single-family) on the market fell for the third straight month (-4.5% y/y). Nevertheless, at the current sales rate there as a 10.2 months' supply on the market. That was down from the April peak of 11.2 months. For single-family homes the inventory ticked up m/m to a 9.6 months supply at the current sales rate, down from an 11.0 months supply in June.
The House testimony offered by Fed GovernorRandall S. Kroszner titled the Effects of the financial crisis on small business is available here.
| Existing Home Sales (Thous) | October | y/y % | September | October '07 | 2007 | 2006 | 2005 |
|---|---|---|---|---|---|---|---|
| Total | 4,980 | -1.6 | 5,140 | 5,020 | 5,672 | 6,508 | 7,076 |
| Northeast | 830 | -9.8 | 840 | 910 | 1,008 | 1,090 | 1,168 |
| Midwest | 1,100 | -9.1 | 1,170 | 1,220 | 1,331 | 1,491 | 1,589 |
| South | 1,840 | -10.2 | 1,900 | 2,050 | 2,240 | 2,576 | 2,704 |
| West | 1,210 | 37.5 | 1,230 | 880 | 1,093 | 1,353 | 1,617 |
| Single-Family | 4,430 | 0.0 | 4,580 | 4,430 | 4,958 | 5,703 | 6,181 |
| Median Price, Total, $ | 183,300 | -11.3 | 191,400 | 206,700 | 216,617 | 222,000 | 218,217 |
by Louise Curley November 24, 2008
 Haver Analytics has a number of series that may prove useful
in comparing and contrasting current conditions with those in the Great
Depression.Among them are the annual series of real and nominal gross
domestic product, its components and prices in USNA
that go back to 1929.
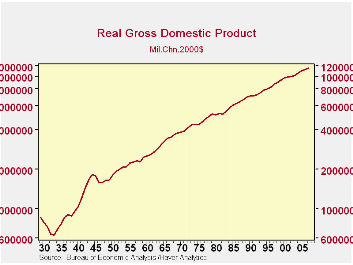
Haver Analytics has a number of series that may prove useful
in comparing and contrasting current conditions with those in the Great
Depression.Among them are the annual series of real and nominal gross
domestic product, its components and prices in USNA
that go back to 1929.
The first chart shows real GDP since 1929, plotted on a log scale to show equal percentage changes. Real GDP declined 26.5% from 1929 to 1933.
Monthly data on the Consumer Price Index are available from January 1921 and are shown in the second chart. Consumer prices declined steadily from 51.9 (1967=100) in May 1929 to 39.4 in December 1933, a decline of 24.1%. These data are found in the Prices section of USECON.
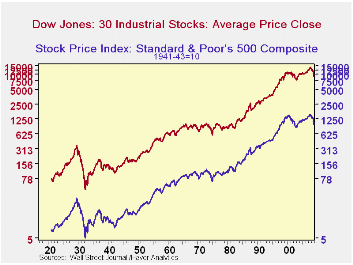
Long term monthly data are also available for stock prices and
interest rates. The third chart show monthly average prices for the Dow
Jones Industrial Average and for the S&P 500 Index. 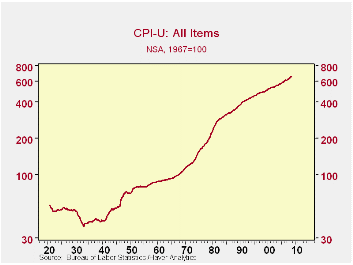 The Dow
Jones declined 87.3% from 364.93 in September, 1929 to 46.19 in July,
1932. The S&P 500 declined 84.8% from 31.30 in September 1929
to 4.77 in June, 1933.
The Dow
Jones declined 87.3% from 364.93 in September, 1929 to 46.19 in July,
1932. The S&P 500 declined 84.8% from 31.30 in September 1929
to 4.77 in June, 1933.
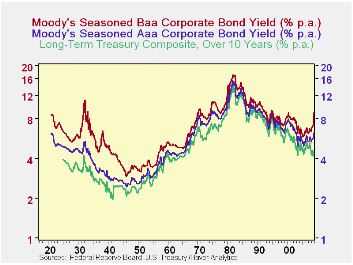
The fourth chart shows the interest rate on the Treasury's
long term composite (over ten years) together with the interest rates
on Moody's AAA and BBB corporate bonds.The rate on the Treasury goes
back to January, 1925 and the rates on Moody's corporates go back to
January 1921. Both the stock market data and interest rates are found
in the Financial Section of USECON.
by Robert Brusca November 24. 2008
 IFO: I
Fell, OUCH!
IFO: I
Fell, OUCH!
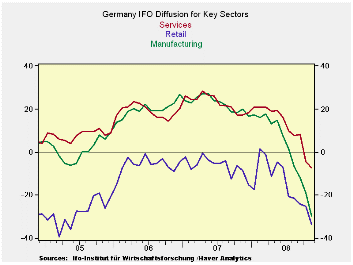
Germany’s IFO index, a focal point for early economic signals
in Germany, fell to a 16 year low in November. Manufacturing has fallen
very hard and fast, as the chart above demonstrates. Going back to
January of 1991 the overall IFO sector index stands in the lower 4% of
its range – in simple terms, it rarely is weaker than this.
Manufacturing is in the bottom 10% of its range. Retailing is in the
bottom 9% of its range. These are extremely weak readings. The service
sector is in the bottom 18% of its range which extends back only to mid
2001. Wholesaling is in the bottom 27% of its range. Construction is
relatively better off standing in the bottom 39% of its range of values
since 1991. In terms of raw readings instead of relative IFO scores we
see a clustering of scores in the -30 region. Wholesaling is a bit
better at -21 and services, a more stable sector overall, registers a
-7.3 net reading. Still for that sector such a raw reading is still in
the bottom 18% of its range.
A fast unravel: Compared to just a month
ago the indices have dropped sharply. The headlines and MFG indices
have shed nearly 10 points in one month. Only in Sept 2001 did the
German sector headline index drop by more. Clearly this downturn is
hitting with lightning speed and a savage punch in Europe where key
policymakers thought they would be spared. Think again.
Headline level is very weak, too -The
headline for the IFO business climate index fell to 85.8 in November
from 90.2 October. This index only fell more sharply than this in Sept
of 2001 after the attack on the US World trade Towers. The current
situation index dropped to a level of 94.8 in November from 99.9 in
October. The expectations index at 81.4 fell to 77.6. The 77.6 reading
is a lifetime low. For current conditions it is a bottom third of the
range reading. For the climate index it’s a bottom 4% of range reading.
Not only is the index falling fast but it is scrapping very low levels.
Germany: harbinger for Euro-weakness --
Clearly the situation in Germany is fluid and falling fast. For all of
the Euro Area new industrial orders were released today and that series
dropped by 3.9% month to month in September and by 5.2% Yr/Yr. The Q3
drop for EMU-wide orders is 7.4% at an annual rate. Among large
countries Germany’s -7.0% Yr/Yr drop is one of the largest among EMU
members; while engineering orders in the EU’s UK are off by 10.7% Yr/Yr.
Autos too - Europe is also having
difficulties in the auto sector as France’s Sarkozy and Germany’s
Merkel in a joint statement indicated their interest to support the
ailing sector.
| Summary of IFO Sector Diffusion readings: CLIMATE | ||||||||
|---|---|---|---|---|---|---|---|---|
| CLIMATE Sum | Current | Last Mo | Since Jan 1991* | |||||
| Nov-08 | Oct-08 | average | Median | Max | Min | range | % range | |
| All Sectors | -29.0 | -20.2 | -7.7 | -8.4 | 16.9 | -30.9 | 47.8 | 4.0% |
| MFG | -29.6 | -18.9 | -0.2 | 1.6 | 27.0 | -35.9 | 62.9 | 10.0% |
| Construction | -30.2 | -27.7 | -28.2 | -30.3 | 1.3 | -50.5 | 51.8 | 39.2% |
| Wholesale | -21.8 | -15.1 | -13.2 | -15.7 | 23.6 | -39.3 | 62.9 | 27.8% |
| Retail | -33.5 | -25.1 | -14.2 | -14.5 | 28.7 | -39.7 | 68.4 | 9.1% |
| Services | -7.3 | -4.3 | 11.0 | 9.5 | 28.5 | -15.2 | 43.7 | 18.1% |

Tom Moeller
AuthorMore in Author Profile »Prior to joining Haver Analytics in 2000, Mr. Moeller worked as the Economist at Chancellor Capital Management from 1985 to 1999. There, he developed comprehensive economic forecasts and interpreted economic data for equity and fixed income portfolio managers. Also at Chancellor, Mr. Moeller worked as an equity analyst and was responsible for researching and rating companies in the economically sensitive automobile and housing industries for investment in Chancellor’s equity portfolio. Prior to joining Chancellor, Mr. Moeller was an Economist at Citibank from 1979 to 1984. He also analyzed pricing behavior in the metals industry for the Council on Wage and Price Stability in Washington, D.C. In 1999, Mr. Moeller received the award for most accurate forecast from the Forecasters' Club of New York. From 1990 to 1992 he was President of the New York Association for Business Economists. Mr. Moeller earned an M.B.A. in Finance from Fordham University, where he graduated in 1987. He holds a Bachelor of Arts in Economics from George Washington University.
More Economy in Brief


