 Global| Apr 25 2006
Chain Store Sales Hold The High Ground, Gas Prices Surge Further
by:Tom Moeller
|in:Economy in Brief
Summary
Chain store sales slipped just 0.2% last week following two consecutive weeks of strong gain, according to the International Council of Shopping Centers (ICSC)-UBS survey. Chain store sales in April are 1.4% above the March average [...]

Chain store sales slipped just 0.2% last week following two consecutive weeks of strong gain, according to the International Council of Shopping Centers (ICSC)-UBS survey.
Chain store sales in April are 1.4% above the March average which rose 0.7% from February.
During the last ten years there has been a 47% correlation between the y/y change in chain store sales and the change in nonauto retail sales less gasoline.
The leading indicator of chain store sales was unchanged (-0.4% y/y) after the prior week's unrevised 0.3% decline. In April, the leading indicator is down 0.4% from the March average which rose 0.3% from February.The ICSC-UBS retail chain-store sales index is constructed using the same-store sales (stores open for one year) reported by 78 stores of seven retailers: Dayton Hudson, Federated, Kmart, May, J.C. Penney, Sears and Wal-Mart.
Retail gasoline prices surged thirteen cents last week to $2.91 per gallon (30.3% y/y) and lifted the April average to $2.74. Relief from the recent upward pressure may have been in evidence yesterday as spot market gasoline prices fell sharply to $2.18 per gallon from $2.35 on Friday.
The Road to Price Stability from the Federal Reserve Board can be found here.
| ICSC-UBS (SA, 1977=100) | 04/22/06 | 04/15/06 | Y/Y | 2005 | 2004 | 2003 |
|---|---|---|---|---|---|---|
| Total Weekly Chain Store Sales | 474.6 | 475.6 | 4.1% | 3.6% | 4.7% | 2.9% |
by Tom Moeller April 25, 2006

The April Index of Consumer Confidence from the Conference Board added 2.0% to the prior month's upwardly revised 4.7% increase. The increase to 109.6 compared to Consensus expectations for a decline to 106.2 and the latest was the highest since May 2002. The University of Michigan's preliminary April Index of Consumer Sentiment rose 0.3% (1.7% y/y).
During the last twenty years there has been a 52% correlation between the level of consumer confidence and the y/y change in real consumer spending. The correlation rose to 66% during the last ten years.
Consumers' assessment of the present situation increased 2.2% and rose for the sixth consecutive month (19.7% y/y). The percentages of respondents who viewed jobs as plentiful (29.1%) and as hard to get (19.6) were at the respective highest and lowest since mid-2003.
The index of consumers' expectations rose another 1.8% (6.0% y/y) as expectations for employment rose but expectations for business conditions and income sagged. Expectations for stock prices rose .
Price inflation expected in twelve months rose to 5.2% from 4.8% expected in February but down sharply from the 6.8% expected last September.
The Conference Board’s survey isconducted by a mailed questionnaire to 5,000 households and about 3,500 typically respond.
| Conference Board | April | Mar | Y/Y | 2005 | 2004 | 2003 |
|---|---|---|---|---|---|---|
| Consumer Confidence | 109.6 | 107.5 | 12.4% | 100.3 | 96.1 | 79.8 |
by Tom Moeller April 25, 2006
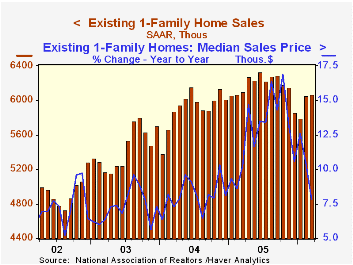
The latest release from the National Association of Realtors is available here.
| Existing Home Sales (000, AR) | Mar | Feb | Y/Y | 2005 | 2004 | 2003 |
|---|---|---|---|---|---|---|
| Total Home Sales | 6,920 | 6,900 | -0.7% | 7,064 | 6,722 | 6,176 |
| Single Family Home Sales | 6,070 | 6,050 | -0.5% | 6,170 | 5,912 | 5,443 |
| Single Family Median Home Price (000) | $217.3 | $216.8 | 7.8% | $206.3 | $182.8 | $169.1 |
by Louise Curley April 25, 2006

Following on yesterday's reports on business confidence from France and Belgium, two more reports were released today from Germany and the Netherlands. In Germany, the IFO institute's index rose to 105.9 in April from 105.4 in March. This was the highest level since April, 1991. In terms of the diffusion index, which shows the percent balance of opinion of the respondents, the excess of optimists over pessimists was 11.0%, up from 10.0% in March. Both measures have been rising for the past four months. The consensus had predicted a slight decline for April. Business confidence has also risen in the Netherlands over the past four months and now the excess of optimists over pessimists is 6.1%, the highest since November 2000. The percent balances for Germany and the Netherlands are shown in the first chart.
In spite of the show of confidence in the current situation, business is beginning to show a little caution regarding the outlook. In Germany the percentage of respondents who expect better conditions six months ahead over those who expect worse condition fell from 13.9% to 13.4%. In the Netherlands the percentage of respondents who expect increased production over the next six months over those who expect lower production fell from 22% to 17% in April. The latter figure is not seasonally adjusted whereas the German figure is.
In addition to the overall measure of the business climate, the IFO also provides measures of the business climate for its component industries--manufacturing, construction, wholesale and retail trade. Also available at a later date are data for the components of the manufacturing industry and a wealth of other detail. Current conditions in manufacturing, construction and wholesale trade all improved in April but the conditions in the retail trade sector deteriorated slightly after a sharp improvement earlier in the year.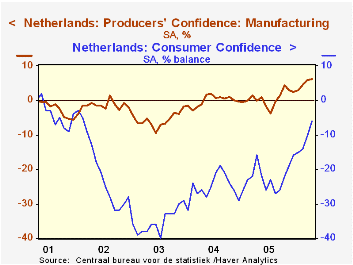
Available since May, 2001, are the results of the IFO's survey of about 2000 firms in the business-oriented segments of the tertiary sector (excluding distribution, financial services, leasing, insurance and government.) This indicator is not yet seasonally adjusted and has not yet been incorporated into the IFO Business Climate Index for industry and trade. In general those engaged in the service sector have had a more positive appraisal of the business climate than those engaged in industry and trade as can be seen in the second chart which compares the diffusion index for the service sector with that for industry and trade.
After September 11, 2001 consumer confidence in the Netherlands fell much more sharply than business confidence and it has yet to reach a point where the optimists outweigh the pessimists, however, the excess of pessimists is diminishing. The third chart compares consumer and business confidence in the Netherlands.
| Confidence Measures Percent Balances |
Apr 06 | Mar 06 | Apr 05 | M/M Dif | Y/Y Dif | 2005 | 2004 | 2003 |
|---|---|---|---|---|---|---|---|---|
| Germany: IFO Business Climate Total |
11.0 | 10.0 | -14.8 | 1.0 | 25.8 | -9.8 | -9.9 | -17.2 |
| Manufacturing | 20.7 | 19.2 | -4.9 | 1.5 | 25.6 | 1.1 | 4.4 | -7.9 |
| Construction | -13.9 | -17.6 | -37.8 | 3.7 | 23.9 | -37.2 | -42.2 | -43.3 |
| Wholesale Trade | 10.7 | 9.6 | -17.4 | 1.1 | 28.1 | -9.9 | -16.6 | -25.3 |
| Retail Trade | -5.3 | -1.8 | -31.1 | -3.5 | 25.8 | -28.0 | -30.8 | -22.6 |
| Service (Not Included in Total) | 23.5 | 21.0 | 5.5 | 2.5 | 18.0 | 8.1 | 6.5 | -0.4 |
| Expectations Total | 13.4 | 13.9 | -10.2 | -0.5 | 23.6 | -5.2 | -2.1 | -6.6 |
| The Netherlands | ||||||||
| Producers' Confidence | 6.1 | 5.8 | -0.1 | 0.2 | 6.2 | 0.6 | -0.1 | -5.6 |
| Expected Production | 17 | 22 | 10 | -5 | 7 | 6 | 4 | 1 |
| Consumer Confidence | -6 | -10 | -16 | 4 | 10 | -22 | -25 | -35 |
| Climate | 6 | -1 | -10 | 7 | 16 | -23 | -32 | -56 |
| Willingness to buy | -14 | -15 | -20 | 1 | 6 | -22 | -21 | -21 |

Tom Moeller
AuthorMore in Author Profile »Prior to joining Haver Analytics in 2000, Mr. Moeller worked as the Economist at Chancellor Capital Management from 1985 to 1999. There, he developed comprehensive economic forecasts and interpreted economic data for equity and fixed income portfolio managers. Also at Chancellor, Mr. Moeller worked as an equity analyst and was responsible for researching and rating companies in the economically sensitive automobile and housing industries for investment in Chancellor’s equity portfolio. Prior to joining Chancellor, Mr. Moeller was an Economist at Citibank from 1979 to 1984. He also analyzed pricing behavior in the metals industry for the Council on Wage and Price Stability in Washington, D.C. In 1999, Mr. Moeller received the award for most accurate forecast from the Forecasters' Club of New York. From 1990 to 1992 he was President of the New York Association for Business Economists. Mr. Moeller earned an M.B.A. in Finance from Fordham University, where he graduated in 1987. He holds a Bachelor of Arts in Economics from George Washington University.


