 Global| Apr 29 2008
Case-Shiller Home Price Index Posts 12.7% y/y Decline
by:Tom Moeller
|in:Economy in Brief
Summary
The S&P/Case-Shiller Composite 20 home price index fell 2.7% m/m in February and that followed declines of similar magnitude during the prior three months. This index of U.S. home prices has fallen in each month since its peak in July [...]
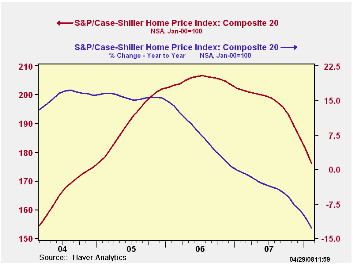
The S&P/Case-Shiller Composite 20 home price index fell 2.7% m/m in February and that followed declines of similar magnitude during the prior three months. This index of U.S. home prices has fallen in each month since its peak in July of 2006 and the decline totals 14.8% during that period. The series dates back only to 2000.
The index of 20 U.S. cities and their surrounding areas is not
adjusted for the quality or the size of a home. The home price index
from the Office of Federal Housing Enterprise Oversight (OFHEO) does
make these adjustments. This series indicates that during the fourth
quarter of 2007 house prices rose a negligible 0.8% y/y, the weakest
gain since 1990.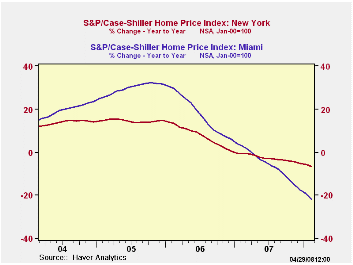
The Case-Shiller composite index of homes in 10 metropolitan areas fell 2.8% (-13.6% y/y) in February. This series dates back to 1987.
Home prices in Las Vegas Nevada were quite weak and fell 22.8% y/y while prices in Miami were off 21.7%. Home prices also fell a sharp 19.2% y/y in San Diego, where they are off by one quarter from their 2006 peak, and in Los Angeles prices fell 19.4% y/y.
Relatively moderate declines were again registered in New York (-6.6% y/y), Chicago (-8.5% y/y), Denver (-5.5% y/y), Seattle (-2.7% y/y) and Dallas (-4.1% y/y).
The latest press release from Standard & Poor's can be found here. An overview of the S&P/Case-Shiller home price series can be found here.
The S&P/Case-Shiller home price series can be found in Haver's REGIONAL database.
| S&P/Case-Shiller Home Price Index (NSA, Jan 00 = 100) | February | January | Y/Y | 2007 | 2006 | 2005 |
|---|---|---|---|---|---|---|
| 20 City Composite Index | 175.94 | 180.75 | -12.7% | -3.8% | 7.6% | 15.8% |
by Tom Moeller April 29, 2008
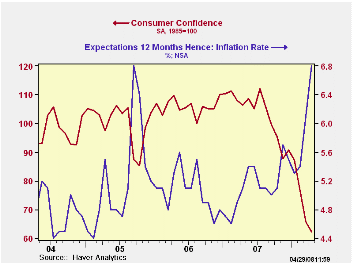
The Conference Board reported that consumer confidence in April fell 5.5% after a 13.7% m/m decline in March. That March decline was slightly less than indicated initially and the April drop about matched Consensus expectations.
The present conditions index led the April decline with a
10.9% m/m drop to the lowest level since late 2003. By region the index
is off most notably in the Pacific, mid-Atlantic, the South Atlantic,
and in the New England states.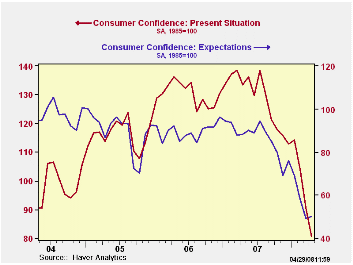
Just 15.3% of respondents saw business conditions as good, the lowest since 2003. Jobs as plentiful were seen by a much lessened 16.6% while 27.9% saw jobs as hard to get, the highest since late 2004.
The expectations component of the index ticked up all of 1.4% after two months of double digit decline. The percentage of respondents expecting better business conditions and more jobs rose slightly while expectations for an increase in income fell. Expectations for the inflation rate surged again to 6.8%, the highest level since 2005.
Respondents planning to buy a household appliance rose slightly but remained well off the early 2007 highs. Plan to but a new automobile rose slightly m/m but also remained well off earlier highs.
Consumer Confidence Surveys: Can They Help Us Forecast Consumer Spending in Real Time? is a 2006 article from the Federal Reserve Bank of Philadelphia. It answers "no" and it is available here.
| Conference Board (SA, 1985=100) | April | March | Y/Y % | 2007 | 2006 | 2005 |
|---|---|---|---|---|---|---|
| Consumer Confidence Index | 62.3 | 65.9 | -41.4 | 103.4 | 105.9 | 100.3 |
| Present Situation | 80.7 | 90.6 | -34.6 | 128.8 | 130.2 | 116.1 |
| Expectations | 50.1 | 49.4 | -43.2 | 86.4 | 89.7 | 89.7 |
by Tom Moeller April 29, 2008
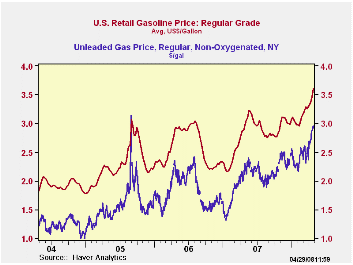
The retail price for a gallon of regular gasoline rose another ten cents last week to $3.60 per gallon, according to the U.S. Department of Energy survey.Prices have now risen 55 cents (18.0%) since the end of last year.
Spot market prices for gasoline may have reached a plateau
this week. Yesterday's wholesale price for a gallon of non-oxygenated
gasoline was $2.92 per gallon, equal to last week's average.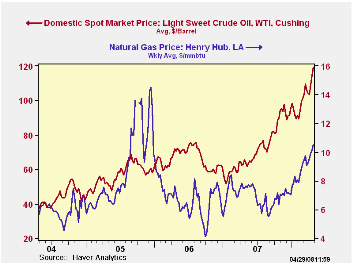
At $118.75, yesterday's price for a barrel of WTI crude oil also was near last week's average of $119.21/bbl.
Natural gas prices, however, continued to surge. A jump yesterday in the wholesale price of natural gas to $11.04 per mmbtu followed last week's surge to an average $10.49/mmbtu.
Weekly gasoline prices can be found in Haver's WEEKLY database, daily prices are found in the DAILY database.
Oil and the U.S. Macro economy: An Update and a Simple Forecasting Exercise is a working paper from the Federal Reserve Bank of St. Louis and it is available here.
| Weekly Prices | 04/28/08 | 04/21/08 | Y/Y | 2007 | 2006 | 2005 |
|---|---|---|---|---|---|---|
| Retail Gasoline ($ per Gallon) | 3.60 | 3.51 | 21.3% | 2.80 | 2.57 | 2.27 |
| Light Sweet Crude Oil, WTI ($ per bbl.) | 119.21 | 114.41 | 82.9% | 94.00 | 61.11 | 58.16 |
by Tom Moeller April 29, 2008
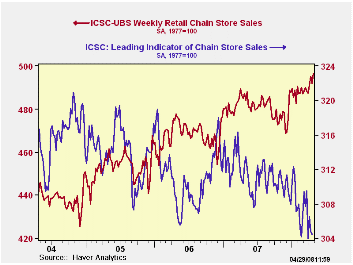
The International Council of Shopping Centers reported, in its ICSC-UBS Chain Store survey, that sales recovered 0.9% last week after the prior period's 0.7% slip.
So far in April, sales have risen 1.0% from March after sales were about unchanged during that month.
During the last ten years there has been a 45% correlation between the y/y change in chain store sales and the change in nonauto retail sales less gasoline.
The ICSC-UBS retail chain-store sales index is constructed using the same-store sales (stores open for one year) reported by 78 stores of seven retailers: Dayton Hudson, Federated, Kmart, May, J.C. Penney, Sears and Wal-Mart.
During the latest week the leading indicator of chain store sales from ICSC-UBS slipped 0.1% (-2.1% y/y) after the 0.6% decline during the prior week.
The chain store sales figures are available in Haver's SURVEYW database.
| ICSC-UBS (SA, 1977=100) | 04/26/08 | 04/19/08 | Y/Y | 2007 | 2006 | 2005 |
|---|---|---|---|---|---|---|
| Total Weekly Chain Store Sales | 496.3 | 491.8 | 1.9% | 2.8% | 3.3% | 3.6% |
by Louise Curley April 29, 2008
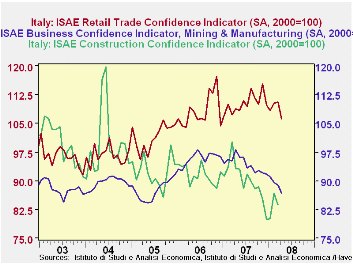
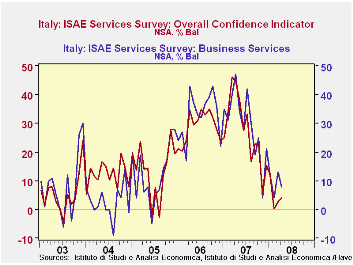
The latest ISAE (Institute for Studies and Economic Analysis) surveys of confidence among entrepreneurs in Italy continue to show weakness. Even among retailers where confidence has held up fairly well, it declined 4.0% in April from March but was still only 2.5% below April 2007. Confidence among manufacturers and miners, which has been declining for over a year, declined 2.1% in April from March, and was 11.4% below April 2007. Confidence in the construction industry is available only through March. In that month confidence in the construction industry was down 3.7% from February and was 16.4% below March, 2007. These three confidence indicators are expressed as indexes with base year 2000 and are shown in the first chart.
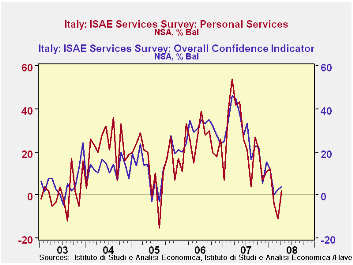
The ISAE survey of confidence in the service industries is expressed in terms of percent balances. In April the excess of optimists over pessimists in all the service industries increased from 2.7% to 4.0% but in April 2007, the excess of optimists was 44.7%. Confidence in the personal service sector declined the most (-13 basis points) from March to April. Confidence in the business sector declined by 5 basis points and confidence in the financial sector services rose 2 basis points. Trends in confidence in the total, business, personal and financial sectors of the service industry are shown in the second and third charts where the steep declines in confidence over the past year in all areas are apparent.
| ITALY ISAE SURVEYS | Apr 08 | Mar 08 | Apr 07 | M/M Chg | Y/Y Chg | 2007 | 2006 | 2005 |
|---|---|---|---|---|---|---|---|---|
| Manufacturing & Mining (2000=100) | 86.9 | 88.8 | 98.1 | -2.14 | -11.42 | 94.3 | 95.8 | 87.5 |
| Retail Trade (2000=100) | 106.2 | 110.6 | 108.9 | -3.98 | -2.48 | 110.2 | 108.2 | 101.4 |
| Services (% balance) | 4.0 | 2.7 | 44.7 | 1.3 | -40.7 | 27.7 | 28.9 | 13.6 |
| Personal Services | 2 | 11 | 42 | -13 | -40 | 25 | 24 | 14 |
| Business Services | 8 | 13 | 47 | -5 | -39 | 30 | 33 | 13 |
| Financial Services | -14 | -16 | 8.0 | 2 | -22 | 0 | 9 | 12 |
by Robert Brusca April 29, 2008
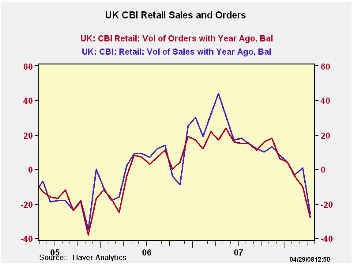
The CBI survey shows sharp weakness on the part of consumers
in April. Sales from one year ago register a -26 on this net balance
scale. Orders are a -28.and sales for the time of year are assessed an
even weaker looking -38. Indeed, sales for the time of year are in the
bottom 9% of their range, the same as for year-ago sales. Orders are in
the bottom 12 percent of their range. The expected readings that apply
to May are similarly weak with orders in the bottom 25 percentile of
their range. Sales for the time of year, as well as the Yr/Yr change in
sales, stand in the lower 10 percentile of their respective readings.
The UK retail sector is beginning to feel some pain. Inventories are
rising and are expected to rise further next month. That could compound
problems in the sector.
| UK Retail volume data CBI Survey | |||||||||
|---|---|---|---|---|---|---|---|---|---|
| Reported: | May-08 | Apr-08 | Mar-08 | Feb-08 | 12Mo Avg | Pcntle | Max | Min | Range |
| Sales/Year Ago | -26 | 1 | -3 | 8 | 9% | 67 | -35 | 102 | |
| Orders/Year Ago | -28 | -10 | -4 | 7 | 12% | 48 | -38 | 86 | |
| Sales: Time/Year | -38 | -14 | -7 | -5 | 9% | 41 | -46 | 87 | |
| Stocks: Sales | 17 | 10 | 11 | 14 | 57% | 30 | 0 | 30 | |
| Expected: | May-08 | ||||||||
| Sales/Year Ago | -15 | -3 | -2 | 10 | 8 | 9% | 67 | -23 | 90 |
| Orders/Year Ago | -14 | -6 | -3 | 10 | 6 | 25% | 47 | -34 | 81 |
| Sales: Time/Year | -26 | -15 | -10 | -5 | -5 | 11% | 45 | -35 | 80 |
| Stocks: Sales | 18 | 11 | 10 | 11 | 12 | 65% | 26 | 3 | 23 |
by Robert Brusca April 29, 2008
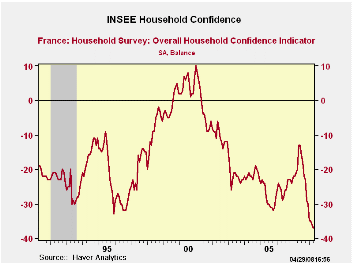
The INSEE household confidence reading is at its lowest mark since 1990. Living standards in the past and next 12-months are assessed as being in the bottom several percentage points of their range for the period. The same is true of the assessment of their financial situation by households.
Unemployment expectations remain subdued however in the lower
35% of their range and they are not on a clear rising trend either.
Price developments are, however, high and rising reading in the 96th
percentile of their range. The spending environment is assessed as
beginning in the bottom quarter of its range since 1990. On balance
French consumers are under pressure and showing some of the same
conditions we see in Italy and in the UK. The last German assessment by
consumers was up. So Germany has some very different dynamics in play
despite the fact its industrial indicators are a tattered its consumers
have gotten a second wind. The Euro Area is generally showing the
impact from financial turmoil and high commodity prices along with a
too-strong currency.
| INSEE Household Monthly Survey | ||||||
|---|---|---|---|---|---|---|
| Since Jan 1990 | ||||||
| Apr-08 | Mar-08 | Feb-08 | Jan-08 | Percentile | Rank | |
| Household Confidence | -37 | -36 | -35 | -35 | 0.0 | 215 |
| Living Standards | ||||||
| Past 12-Mos | -69 | -71 | -68 | -65 | 2.2 | 214 |
| Next 12-Mos | -43 | -40 | -42 | -44 | 1.7 | 214 |
| Unemployment: Next 12 | 3 | 11 | 11 | 9 | 36.4 | 176 |
| Price Developments | ||||||
| Past 12-Mos | 56 | 60 | 43 | 39 | 96.6 | 2 |
| Next 12-Mos | -36 | -41 | -25 | -12 | 26.4 | 108 |
| Savings | ||||||
| Favorable to Save | 24 | 25 | 24 | 27 | 55.6 | 101 |
| Ability to Save Next 12 Mos | -13 | -16 | -13 | -12 | 34.5 | 161 |
| Spending | ||||||
| Favorable for major purchase | -28 | -28 | -26 | -25 | 24.1 | 198 |
| Financial Situation | ||||||
| Current | 12 | 13 | 13 | 14 | 42.9 | 104 |
| Past 12-Mos | -29 | -30 | -27 | -25 | 4.0 | 214 |
| Next 12-Mos | -16 | -14 | -14 | -14 | 0.0 | 214 |
| Number of observations in the period | 220 | |||||

Tom Moeller
AuthorMore in Author Profile »Prior to joining Haver Analytics in 2000, Mr. Moeller worked as the Economist at Chancellor Capital Management from 1985 to 1999. There, he developed comprehensive economic forecasts and interpreted economic data for equity and fixed income portfolio managers. Also at Chancellor, Mr. Moeller worked as an equity analyst and was responsible for researching and rating companies in the economically sensitive automobile and housing industries for investment in Chancellor’s equity portfolio. Prior to joining Chancellor, Mr. Moeller was an Economist at Citibank from 1979 to 1984. He also analyzed pricing behavior in the metals industry for the Council on Wage and Price Stability in Washington, D.C. In 1999, Mr. Moeller received the award for most accurate forecast from the Forecasters' Club of New York. From 1990 to 1992 he was President of the New York Association for Business Economists. Mr. Moeller earned an M.B.A. in Finance from Fordham University, where he graduated in 1987. He holds a Bachelor of Arts in Economics from George Washington University.
More Economy in Brief


