 Global| Mar 30 2010
Case-Shiller Home Price Index Hits A Brick Wall?
by:Tom Moeller
|in:Economy in Brief
Summary
News-wire headlines indicate that the rebound in home prices has stalled. Seasonally adjusted, the Case Shiller Home Price Index fell during January by 0.4% for the fourth consecutive month. This, however, overstates the weakness [...]
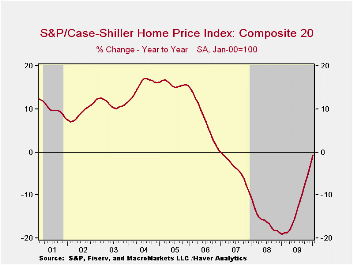
News-wire headlines indicate that the rebound in home prices has stalled. Seasonally adjusted, the Case Shiller Home Price Index fell during January by 0.4% for the fourth consecutive month. This, however, overstates the weakness since seasonally adjusted prices have been rising slightly since last June. Regardless, the y/y trend paints a different picture of improvement. The 0.7% decline versus last January compares to a 19.0% y/y rate of decline at its worst one year ago. That's not a barn-burning improvement, however, and it may not go much further unless home sales improve.
The narrower 10 City Composite Index rose a seasonally adjusted 0.4% (-0.0% y/y) for the second month. The 12-month decline also eased from -19.4% at its worst. By far, these negative comparisons outpace those during the 1990-91 recession when home prices fell 6.3%.
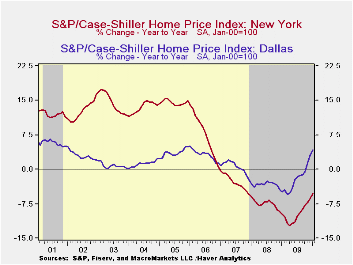
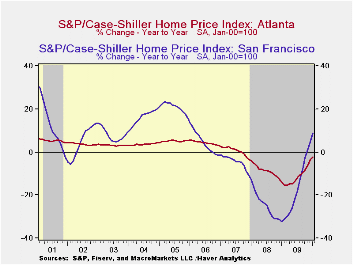
The performance of home prices continues to vary around the country. During January, yearly price gains improved in twelve cities including Boston, San Diego, Los Angeles, San Francisco, Denver, Dallas and Washington D.C. They continued down in seven cities including Atlanta, Chicago, Miami, Detroit and Seattle.
The Case Shiller home price series are value-weighted, i.e., a greater index weight is assigned to more expensive homes. The S&P/Case-Shiller home price series can be found in Haver's USECON database and the city data highlighted below is in the REGIONAL database.
Responding to the foreclosure crisis—A conference summary from the Federal Reserve Bank of Chicago is available here.
| S&P/Case-Shiller Home Price Index (SA, Jan 00 = 100) | January m/m | December m/m | November m/m | Jan. y/y | 2009 | 2008 | 2007 |
|---|---|---|---|---|---|---|---|
| 20 City Composite Index | 0.3 | 0.3% | 0.3% | -0.7% | -13.3% | -15.7% | -3.8% |
| Regional Indicators | |||||||
| Atlanta | -0.5 | 0.0 | 0.1 | -2.1 | -11.6 | -8.5 | 0.7 |
| Boston | 0.3 | 0.7 | 0.6 | 1.5 | -4.9 | -5.7 | -4.0 |
| Chicago | -0.8 | -0.7 | -0.7 | -4.3 | -14.2 | -10.0 | -1.0 |
| Dallas | -0.3 | 0.2 | 0.9 | 4.2 | -2.3 | -3.2 | 0.5 |
| Denver | 0.1 | -0.0 | 0.3 | 2.8 | -2.8 | -4.9 | -1.7 |
| Los Angeles | 1.8 | 1.2 | 1.4 | 3.8 | -15.4 | -24.2 | -5.2 |
| New York | -0.3 | -0.4 | -0.9 | -5.4 | -9.8 | -7.4 | -2.8 |
| San Francisco | 0.6 | 0.8 | 1.2 | 9.1 | -18.4 | -24.3 | -4.5 |

Tom Moeller
AuthorMore in Author Profile »Prior to joining Haver Analytics in 2000, Mr. Moeller worked as the Economist at Chancellor Capital Management from 1985 to 1999. There, he developed comprehensive economic forecasts and interpreted economic data for equity and fixed income portfolio managers. Also at Chancellor, Mr. Moeller worked as an equity analyst and was responsible for researching and rating companies in the economically sensitive automobile and housing industries for investment in Chancellor’s equity portfolio. Prior to joining Chancellor, Mr. Moeller was an Economist at Citibank from 1979 to 1984. He also analyzed pricing behavior in the metals industry for the Council on Wage and Price Stability in Washington, D.C. In 1999, Mr. Moeller received the award for most accurate forecast from the Forecasters' Club of New York. From 1990 to 1992 he was President of the New York Association for Business Economists. Mr. Moeller earned an M.B.A. in Finance from Fordham University, where he graduated in 1987. He holds a Bachelor of Arts in Economics from George Washington University.
More Economy in Brief


