 Global| Dec 06 2006
ADP Report: Private Sector Jobs Rose 158,000 in November
by:Tom Moeller
|in:Economy in Brief
Summary
The ADP Nat'l Employment Report, reported by the payroll processor, indicated a 158,000 rise in private nonfarm payrolls last month. A 97,500 increase had been expected and the November figure from the U.S. Bureau of Labor Statistics [...]
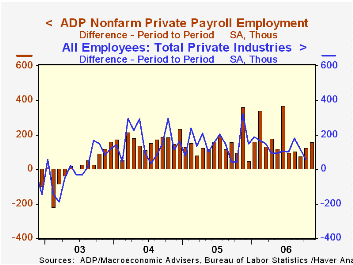
The ADP Nat'l Employment Report, reported by the payroll processor, indicated a 158,000 rise in private nonfarm payrolls last month. A 97,500 increase had been expected and the November figure from the U.S. Bureau of Labor Statistics will be published this Friday.
Last month, ADP's measure of private nonfarm payrolls for October indicated a 128,000 rise in jobs that was followed by a 58,000 rise in private nonfarm payrolls, when published by BLS.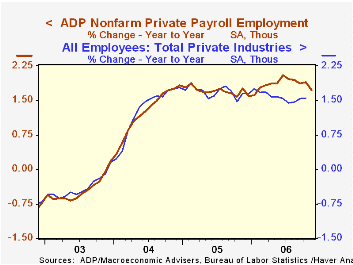
ADP compiled the estimate from its database of individual companies' payroll information. Macroeconomic Advisers, LLC, the St. Louis economic consulting firm, developed the methodology for transforming the raw data into an economic indicator.
According to ADP and Macro Advisers, the correlation between the monthly percentage change in the ADP estimate and that in the BLS data is 0.90.
The ADP National Employment Report data is maintained in Haver's USECON database; historical data go back to December 2000. The figures in this report cover only private sector jobs and exclude employment in the public sector, which rose an average 11,083 during the last twelve months.
The full ADP National Employment Report can be found here, and the ADP methodology is explained here.
| LAXEPA@USECON | November | October | Y/Y | 2005 | 2004 | 2003 |
|---|---|---|---|---|---|---|
| Nonfarm Private Payroll Employment (Chg.) | 158,000 | 128,000 | 1.7% | 1.7% | 1.3% | -0.4% |
by Tom Moeller December 6, 2006
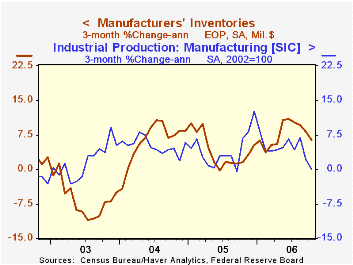
Factory inventories rose an even slower 0.4% during October, half the 0.8% average gain during the prior six months. It was the slowest increase since a 0.5% decline in inventories during February and the y/y rise ticked lower to 7.1%.
The slowdown has been mostly due to lower oil prices which in October were mostly responsible for a 4.9% (+5.6% y/y) decline in petroleum refineries' inventories. Less petroleum, factory inventories grew 0.7% (7.1% y/y) in October, equal to the average of the prior six months.
Inventories of computers & electronic products recovered 0.6% (8.7% y/y) after a 0.1% slip during September, though the latest figure reflected a 17.2% (-11.2% y/y) drop in computers. Primary metals inventories surged 1.6% (19.0% y/y) in October, though that was the slowest increase in four months. Inventories of electrical equipment rose 0.5% (10.9% y/y) after the 0.9% September drop yet the 3-month change fell to 5.2% (AR), half the rate of growth during the first nine months of 2006. Furniture inventories rose 1.1% and the 3-month change rose to 10.2% while machinery inventories increased 0.3% after a 1.6% September spike.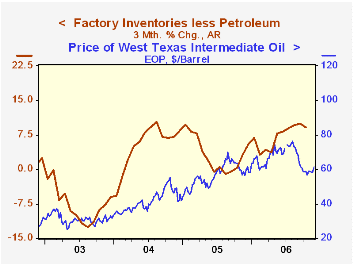
Total factory orders fell a hard 4.7% reflecting the 8.2% drop in durable goods orders which was little revised from the advance report. That reflected a 44.6% (+23.0% y/y) plunge in aircraft orders. Factory orders less transportation fell 0.8% (+1.4% y/y). Much of the recently slower growth in this measure reflects petroleum where orders (which equal shipments) fell 3.7% (-15.1% y/y) in October. Still, non-transportation orders less oil fell 0.6% (+3.3% y/y) in October for the third consecutive monthly decline.
Factory shipments rose 0.1%. Factory shipments less transportation & petroleum eked out a 0.4% (3.7% y/y) increase after a 2.6% September decline.
Unfilled orders rose another 1.2% due to a 2.4% (53.9% y/y) jump in civilian aircraft. Less the transportation sector altogether backlogs rose 1.0% (13.3% y/y).
| Factory Survey (NAICS) | October | September | Y/Y | 2005 | 2004 | 2003 |
|---|---|---|---|---|---|---|
| Inventories | 0.4% | 0.6% | 7.1% | 4.0% | 6.9% | -7.4% |
| New Orders | -4.7% | 1.7% | 0.6% | 8.5% | 7.5% | 0.9% |
| Shipments | 0.1% | -4.2% | 1.0% | 7.1% | 6.8% | 0.2% |
| Unfilled Orders | 1.2% | 4.1% | 21.9% | 16.3% | 4.5% | -1.0% |
by Tom Moeller December 6, 2006

The total number of mortgage applications rose 8.1% last week and recovered all of the sharp declines during the prior two weeks, according to the Mortgage Bankers Association.
Purchase applications jumped 4.9%, the largest weekly increase in a month, spurred by lower interest rates & price concessions. During November purchase applications rose 6.4% from the October level and in early December purchase applications are 5.1% above the November average.
During the last ten years there has been a 58% correlation between the y/y change in purchase applications and the change in new plus existing single family home sales.
Applications to refinance jumped 13.7% and recovered most of the prior two weeks' sharp decline.
The effective interest rate on a conventional 30-year mortgage dropped sixteen basis points to 6.16%. The peak for 30 year financing was 7.08% late in June. Rates for 15-year financing also fell sharply to 5.91%, the first time below 6% since January. Interest rates on 15 and 30 year mortgages are closely correlated (>90%) with the rate on 10 year Treasury securities.
During the last ten years there has been a (negative) 79% correlation between the level of applications for purchase and the effective interest rate on a 30-year mortgage.
The Mortgage Bankers Association surveys between 20 to 35 of the top lenders in the U.S. housing industry to derive its refinance, purchase and market indexes. The weekly survey covers roughly 50% of all U.S. residential mortgage applications processed each week by mortgage banks, commercial banks and thrifts. Visit the Mortgage Bankers Association site here.
| MBA Mortgage Applications (3/16/90=100) | 12/01/06 | 11/24/06 | Y/Y | 2005 | 2004 | 2003 |
|---|---|---|---|---|---|---|
| Total Market Index | 647.6 | 599.0 | -1.4% | 708.6 | 735.1 | 1,067.9 |
| Purchase | 426.6 | 406.7 | -13.8% | 470.9 | 454.5 | 395.1 |
| Refinancing | 1,989.7 | 1,749.6 | 24.6% | 2,092.3 | 2,366.8 | 4,981.8 |
by Carol Stone December 6, 2006
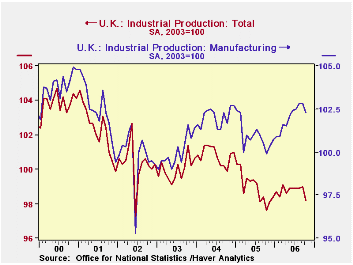
UK industrial production declined unexpected in October, falling 0.8% compared to +0.1% forecast by a couple of consensus surveys of economists. The manufacturing sector was off 0.5%, in the face of an expected 0.2% increase. A number of factors accounted for the retreat.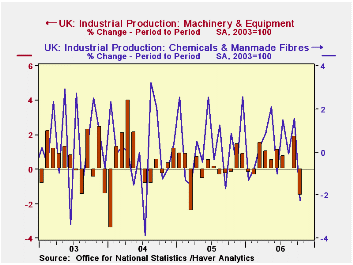
Total output was pushed down by a renewed decline in oil and gas extraction. The UK's oil production has been falling for several years, but had managed a bounce in September. This was more than reversed in October. Utility output continued a decline, which was quite large in October and attributed by some to unusually mild weather.
Manufacturing, the key cyclical sector, saw a 0.5% decrease in production. Press reports argued that the strength in the pound over the last several months was starting to hurt exports. This is possible, as seen in the accompanying chart. Machinery seems to be the main broad area showing weakness and that could relate to non-competitive pricing conditions in world markets.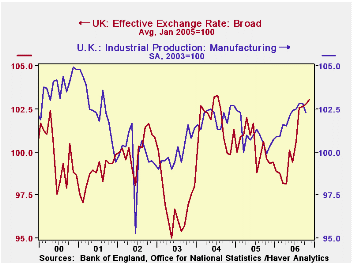 The same is true for pharmaceuticals. However, in several of these instances, output had been up in prior months, so a downturn in one month is hard to blame on such fundamental factors, especially for items like machines that have fairly long lead-times. Note too that the relationship of British manufacturing to the currency value is quite loose. So until there's more evidence, it seems too soon to decide firmly on a cause for this sudden downdraft in industry. In fact, the ONS's preferred measure, the last three months average compared with the prior three months average, was still rising, by 0.3%. This is considerably less, though, than the 0.8% or 0.9% of the other recent periods
| UK | Oct 2006 | Sept 2006 | Aug 2006 | Year Ago | 2005 | 2004 | 2003 |
|---|---|---|---|---|---|---|---|
| Total, 2003 =100 | 98.2 | 99.0 | 98.9 | 97.6 | 99.0 | 100.8 | 100.0 |
| % Change | -0.8 | 0.1 | 0.0 | 2.1 | -1.8 | 0.8 | -0.3 |
| Oil & Gas | -2.6 | 2.1 | -1.9 | -11.3 | -9.9 | -8.4 | -5.6 |
| Manufacturing, 2003=100 | 102.3 | 102.8 | 102.8 | 99.9 | 101.0 | 102.0 | 100.0 |
| % Change | -0.5 | 0 | 0.3 | 4.8 | -1.0 | 2.0 | 0.2 |
| Electricity, Gas, & Water | -3.1 | -0.3 | -0.6 | -4.3 | -0 | 1.1 | 1.6 |
Tom Moeller
AuthorMore in Author Profile »Prior to joining Haver Analytics in 2000, Mr. Moeller worked as the Economist at Chancellor Capital Management from 1985 to 1999. There, he developed comprehensive economic forecasts and interpreted economic data for equity and fixed income portfolio managers. Also at Chancellor, Mr. Moeller worked as an equity analyst and was responsible for researching and rating companies in the economically sensitive automobile and housing industries for investment in Chancellor’s equity portfolio. Prior to joining Chancellor, Mr. Moeller was an Economist at Citibank from 1979 to 1984. He also analyzed pricing behavior in the metals industry for the Council on Wage and Price Stability in Washington, D.C. In 1999, Mr. Moeller received the award for most accurate forecast from the Forecasters' Club of New York. From 1990 to 1992 he was President of the New York Association for Business Economists. Mr. Moeller earned an M.B.A. in Finance from Fordham University, where he graduated in 1987. He holds a Bachelor of Arts in Economics from George Washington University.


