 Global| Jul 30 2008
ADP Report: July Payrolls RoseWith Service Sector Hiring
by:Tom Moeller
|in:Economy in Brief
Summary
The ADP National Employment Report, from the payroll processor, indicated that July private nonfarm payrolls rose 9,000 after a revised 77,000 worker decline during June. Expectations had been for a July decline of 60,000. The U.S. [...]
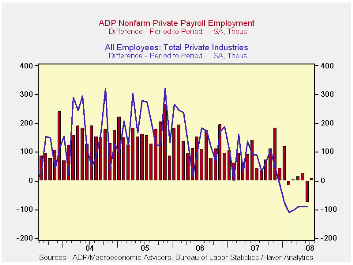
The ADP National Employment Report, from the payroll processor, indicated that July private nonfarm payrolls rose 9,000 after a revised 77,000 worker decline during June. Expectations had been for a July decline of 60,000.
The U.S. Bureau of Labor Statistics will report on July nonfarm payrolls this Friday. Last month, the 77,000 worker decline in ADP's measure of private nonfarm payrolls was accompanied by a 91,000 worker decline in the BLS measure of private sector payrolls.According to ADP and Macro Advisers, the correlation between the monthly percentage change in the ADP estimate and that in the BLS data is 0.90.
Higher employment in the service producing industry accounted
for the gain in ADP's measure for July with a 74,000 (1.1% y/y)
increase. Small payrolls rose 56,000 (1.6% y/y) while medium sized
payrolls increased 20,000 (1.2% y/y). Large service producing payrolls
reported a 2,000 (-0.4% y/y) decline which was the seventh drop in the
last eight months.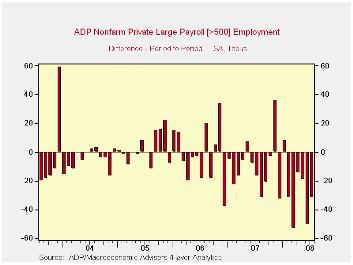
Goods producing payrolls fell by 65,000 (-2.5% y/y) led by a large decline of 29,000 (-2.7% y/y) in medium sized payrolls and a 30,000 (-4.3% y/y) worker decline in large payrolls.
The ADP sub-index for large payrolls overall fell 32,000 (-1.3% y/y) following a 51,000 worker drop during June.
A 9,000 (+0.4% y/y) worker decline in medium sized payrolls followed a 33,000 shortfall during June.
Small sized payrolls in July rose 50,000 (1.2% y/y) and that
followed a meager 7,000 June uptick.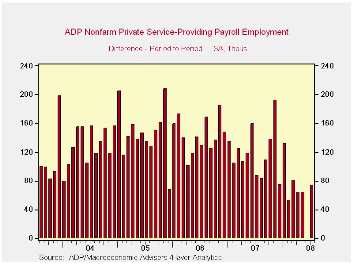
ADP compiled the estimate from its database of individual companies' payroll information. Macroeconomic Advisers, LLC, the St. Louis economic consulting firm, developed the methodology for transforming the raw data into an economic indicator.
The ADP National Employment Report data is maintained in Haver's
USECONdatabase; historical data go back to December 2000. The figures in this report cover only private sector jobs and exclude employment in the public sector, which rose an average 11,083 during the last twelve months.
The full ADP National Employment Report can be found here, and the ADP methodology is explained here.
Interpreting the Great Moderation: Changes in the Volatility of Economic Activity at the Macro and Micro Levels from the Federal Reserve Bank of New York is available here.
| LAXEPA@USECON | July | June | Y/Y | 2007 | 2006 | 2005 |
|---|---|---|---|---|---|---|
| Nonfarm Private Payroll Employment (m/m Chg.) | 9,000 | -77,000 | 0.5% | 1.1% | 1.7% | 1.8% |
by Tom Moeller July 30, 2008
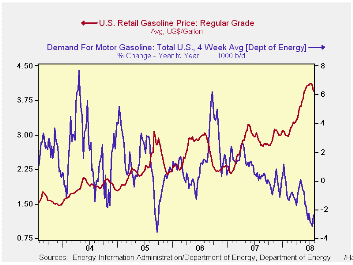
The retail price for a gallon of regular gasoline fell ten cents last week to $3.96 per gallon, according to the U.S. Department of Energy survey. That added to a five cent decline during the prior week and reduced prices to their lowest level since late May. For all grades of gasoline the average price fell eleven cents to $4.01 per gallon.
Yesterday, the spot market price for a gallon of regular
gasoline fell to $2.91 per gallon versus last week's average of $2.98.
That was down from the high two weeks ago above $3.40.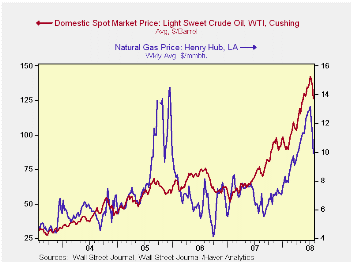
Weekly gasoline prices can be found in Haver's WEEKLY database, daily prices are in the DAILY database.
According to the U.S. Department of Energy, though the demand for gasoline was unchanged last week from the prior period, gasoline demand during the latest four weeks fell 3.2% from a year earlier. That y/y decline nearly equaled the decline in gasoline demand three years ago when Hurricane Katrina struck and it limited gasoline supplies.
The DOE figures are available in Haver's OILWKLY database.
The price for a barrel of West Texas Intermediate crude oil also declined last week by nine dollars per barrel to an average $126.14, down from $142.46 at the beginning of the month.Yesterday, the price for a barrel of crude was $122.19.
Prices for natural gas slipped for a third week to an average $9.93 per mmbtu (72.3% y/y).
Budget of the United States Government: Browse Fiscal Year 2009 here.
| Weekly Prices | 07/28/08 | 07/21/08 | Y/Y | 2007 | 2006 | 2005 |
|---|---|---|---|---|---|---|
| Retail Regular Gasoline ($ per Gallon) | 3.96 | 4.06 | 37.5% | 2.80 | 2.57 | 2.27 |
| Light Sweet Crude Oil, WTI ($ per bbl.) | 126.14 | 135.34 | 67.7% | 72.25 | 66.12 | 56.60 |
by Robert Brusca July 30, 2008
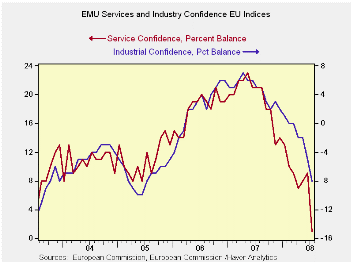
The picture on top captures the path of the industrial sector and the services sector in EMU. Both have turned sharply lower by mid 2008 after having peaked about one year ago. The overall EMU sentiment index is now in the 36th percentile of its range nearly at the border of the bottom third of its range, a weak enough position that makes it reasonable to talk of downside risks and even recession potential. The two weakest sectors/areas by their percentile standings are services (15th percentile) and Consumer confidence (24th percentile). The industrial and construction sectors are the relative strongest with standings at about the mid 50s percent of their respective ranges.
In July all sectors fell and most fell sharply. Services with a seven point fall and retailing with a six point fall made the largest drops in the month.
The largest EMU and EU countries saw their overall sentiment gauges fall in the month with only the smallest of the large countries (Spain) showing month-to-month improvement. In the case of Spain, however, the ‘bounce’ is a bit of a ‘dead cat bounce’ since among these large European economies Spain’s has the lowest percentile standing for its overall sentiment reading which stands at a very lowly 14 percent. At 26 percent the UK is the next lowest and at 27 percent Italy is the third lowest. France is the relative strongest at a percentile reading of 46, followed by Germany at 44 percent. The EMU relative reading at 37.4 percent is just slightly above the EU reading which is 36.0 percent.
We focus on these percent percentile readings since each industry and country has its own range and dynamic in terms of these net balance readings. By drawing attention to the percentile position of a reading in a range of the EU net balance outcomes we can compare across industries and countries with greater confidence that we are comparing apples with apples or oranges with oranges.
By comparison, look at the raw net balance readings. In July all the sector net balance readings are negative except services, which is at zero. But at zero services is relatively weaker in its range than are the other sector readings (compare their percentiles!). In perusing the data you might be tempted to see services as the strong sector since it is zero while the others are negative. But the fact is that the services gauge is simply less prone to fall into negative territory and at zero it is signaling greater sector weakness in services than a -20 reading would be signaling for consumer confidence.
These EC Commission surveys are very comprehensive, covering the various EU/EMU member countries and all the relevant sectors by country. A full perusal of this month’s data reveals a very weak Europe and one that is in the process of weakening sharply as well. At the same time the topical inflation report for Germany suggests that headline inflation is still pushing higher, something that will keep the ECB back on its heels.
We continue to see the GLOBAL slowdown as a reaction to the rise in commodity prices – especially oil - a gain that has taken a toll on all the major consuming nations. The US slowdown, the global financial tangle and the rise in oil prices are hitting the world economies at the same time. It is no wonder that the global business cycle is back in sync…or should I say sink?
| EU Sectors and Country level Overall Sentiment | |||||||||||
|---|---|---|---|---|---|---|---|---|---|---|---|
| EU | Jul 08 |
Jun 08 |
May 08 |
Apr 08 |
%tile | Rank | Max | Min | Range | Mean | R-SQ w/Overall |
| Overall | 88.7 | 94.5 | 97.1 | 98 | 36.0 | 225 | 116 | 73 | 43 | 101 | 1.00 |
| Industrial | -8 | -4 | -3 | -2 | 55.9 | 144 | 7 | -27 | 34 | -6 | 0.87 |
| Consumer Confidence | -20 | -17 | -14 | -12 | 24.1 | 227 | 2 | -27 | 29 | -10 | 0.83 |
| Retail | -11 | -5 | -3 | -6 | 37.0 | 212 | 6 | -21 | 27 | -5 | 0.48 |
| Construction | -17 | -14 | -11 | -11 | 53.2 | 154 | 5 | -42 | 47 | -15 | 0.42 |
| Services | 0 | 7 | 6 | 6 | 15.8 | 129 | 32 | -6 | 38 | 17 | 0.79 |
| % m/m | Jul 08 |
Based on Level | Level | ||||||||
| EMU | -5.6% | -2.9% | 0.5% | 89.5 | 37.4 | 222 | 117 | 73 | 44 | 101 | 0.93 |
| Germany | -4.1% | -1.5% | 0.2% | 97.3 | 44.1 | 158 | 121 | 79 | 42 | 101 | 0.64 |
| France | -4.8% | -3.0% | -1.8% | 93.5 | 46.6 | 188 | 119 | 72 | 47 | 101 | 0.81 |
| Italy | -10.1% | -0.1% | 3.3% | 85.4 | 27.6 | 230 | 122 | 71 | 51 | 101 | 0.80 |
| Spain | 1.6% | -7.8% | -0.4% | 74.2 | 14.6 | 238 | 118 | 67 | 51 | 100 | 0.60 |
| Memo:UK | -7.8% | 2.3% | -5.4% | 85.5 | 26.5 | 229 | 132 | 69 | 64 | 102 | 0.41 |
| Since 1990 except Services (Oct 1996): 247 | -Count | Services: | 142 | -Count | |||||||
| Sentiment is an index, sector readings are net balance diffusion measures | |||||||||||
by Robert Brusca July 30, 2008
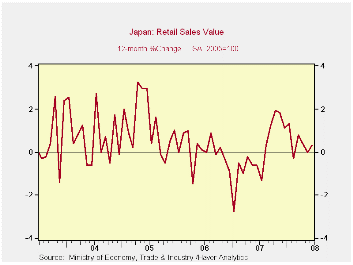
Nominal retail sales fell by 0.2% in June as inflation pushed
ahead driving real retail sales to a 0.7% drop. Inflation adjusted
sales have been dropping at an increasingly rapid rate. But, Yr/Yr
sales growth is still positive. In the quarter to date, real retail
sales are falling at a 2.8% annual pace.
Japan shows signs of economic slippage as the authorities have
been expressing more concerns. Japan’s Economics Minister Hiroko Ota
said that weak job data reflected a stalling in Japan's economy.
Government data showed that the jobless rate rose in June to a near
two-year high of 4.1 percent and household spending fell again from a
year earlier, in a sigh of further trouble for an economy already
battered by surging energy costs and faced with slowing exports. Retail
sales adjusted for inflation are another sign in this series of
measures reminding us that Japan is facing severe challenges.
| Japan Retail Sales Trends | ||||||||
|---|---|---|---|---|---|---|---|---|
| Total Retail Sales | Jun 08 |
May 08 |
Apr 08 |
3MO | 6MO | 12MO | YrAgo | QTR-to Date |
| Sales SA | 0.0% | -0.1% | -0.1% | -0.8% | 0.2% | 0.3% | 0.6% | -0.8% |
| Motor Vehicles | -3.1% | -3.2% | 1.7% | -17.0% | -12.1% | -0.7% | -5.3% | -13.0% |
| Food & Beverages | -0.3% | 2.3% | -0.5% | 6.0% | 6.4% | 3.6% | -0.3% | 5.1% |
| Fabrics & Apparel | 2.2% | -0.2% | -2.5% | -2.2% | 4.9% | -1.3% | -4.8% | -9.0% |
| Real Retail | -0.7% | -0.7% | 0.2% | -4.8% | -2.4% | -1.7% | 0.7% | -2.8% |
| Memo: CPI | 0.7% | 0.6% | -0.3% | 4.0% | 2.6% | 2.0% | -0.1% | 2.0% |

Tom Moeller
AuthorMore in Author Profile »Prior to joining Haver Analytics in 2000, Mr. Moeller worked as the Economist at Chancellor Capital Management from 1985 to 1999. There, he developed comprehensive economic forecasts and interpreted economic data for equity and fixed income portfolio managers. Also at Chancellor, Mr. Moeller worked as an equity analyst and was responsible for researching and rating companies in the economically sensitive automobile and housing industries for investment in Chancellor’s equity portfolio. Prior to joining Chancellor, Mr. Moeller was an Economist at Citibank from 1979 to 1984. He also analyzed pricing behavior in the metals industry for the Council on Wage and Price Stability in Washington, D.C. In 1999, Mr. Moeller received the award for most accurate forecast from the Forecasters' Club of New York. From 1990 to 1992 he was President of the New York Association for Business Economists. Mr. Moeller earned an M.B.A. in Finance from Fordham University, where he graduated in 1987. He holds a Bachelor of Arts in Economics from George Washington University.
More Economy in Brief


