 Global| Oct 29 2004
3Q US GDP Light at 3.7%
by:Tom Moeller
|in:Economy in Brief
Summary
US real GDP grew 3.7% (AR) last quarter versus the Consensus expectation for growth of 4.5%. Nevertheless, 3Q growth was a slight acceleration from 3.3% in 2Q. The shortfall in GDP growth relative to expectations reflected meager [...]
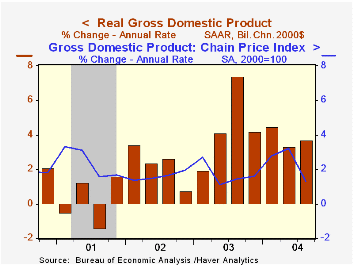
US real GDP grew 3.7% (AR) last quarter versus the Consensus expectation for growth of 4.5%. Nevertheless, 3Q growth was a slight acceleration from 3.3% in 2Q.
The shortfall in GDP growth relative to expectations reflected meager contributions from residential investment (0.2 percentage points versus 0.9 points in 2Q) and from government spending (0.3 percentage points versus 0.4 points in 2Q).
Weakness in these categories limited growth in domestic final demand to 4.6% versus 3.5% in 2Q. Personal consumption growth sped up to 4.4% versus 1.6% in 2Q with spending on motor vehicles up 27.2% after a slight 2Q decline. Spending on apparel also recovered after a 2Q decline and furniture spending continued to boom at a 10.3% rate (9.7% y/y).
Business investment growth also continued strong at an 11.7% rate (9.8% y/y) with spending on equipment & software up 14.9% (12.2% y/y). Spending on information processing equipment & software rose only 4.4% (12.7% y/y), however, spending on industrial equipment rose 30.1% and transportation rose 27.0%.
Slower accumulation of inventories subtracted 0.5 percentage points from GDP growth, the first negative contribution since 2Q03 though it was dominated by a huge drawdown of motor vehicle inventories. (Real motor vehicle output rose 10.0% (1.1% y/y) last quarter, the net of the boom in vehicle sales and the drawdown of inventories.)
Foreign trade again subtracted from GDP growth as a 5.1% (9.2% y/y) rise in exports was outpaced by a 7.7% (11.9% y/y) gain in imports.
Expanded detail indicated that GDP less motor vehicles rose 3.5% (4.0% y/y) and that GDP less computers rose 3.7% (3.9% y/y).
Price inflation was quite tame at 1.3%, about as expected. Lower prices for consumer durables and for business investment in equipment & software as well as a light 1.6% increase in prices paid by the federal government held back the increase.
| Chained 2000$, % AR | 3Q '04 (Advance) | 2Q '04 | Y/Y | 2003 | 2002 | 2001 |
|---|---|---|---|---|---|---|
| GDP | 3.7% | 3.3% | 3.9% | 3.0% | 1.9% | 0.8% |
| Inventory Effect | -0.5% | 0.8% | 0.5% | -0.1% | 0.5% | -0.8% |
| Final Sales | 4.2% | 2.5% | 3.4% | 3.1% | 1.4% | 1.6% |
| Trade Effect | -0.6% | -1.1% | -0.7% | -0.3% | -0.7% | -0.2% |
| Domestic Final Demand | 4.6% | 3.5% | 4.1% | 3.4% | 2.1% | 1.8% |
| Chained GDP Price Index | 1.3% | 3.2% | 2.2% | 1.8% | 1.7% | 2.4% |

Tom Moeller
AuthorMore in Author Profile »Prior to joining Haver Analytics in 2000, Mr. Moeller worked as the Economist at Chancellor Capital Management from 1985 to 1999. There, he developed comprehensive economic forecasts and interpreted economic data for equity and fixed income portfolio managers. Also at Chancellor, Mr. Moeller worked as an equity analyst and was responsible for researching and rating companies in the economically sensitive automobile and housing industries for investment in Chancellor’s equity portfolio. Prior to joining Chancellor, Mr. Moeller was an Economist at Citibank from 1979 to 1984. He also analyzed pricing behavior in the metals industry for the Council on Wage and Price Stability in Washington, D.C. In 1999, Mr. Moeller received the award for most accurate forecast from the Forecasters' Club of New York. From 1990 to 1992 he was President of the New York Association for Business Economists. Mr. Moeller earned an M.B.A. in Finance from Fordham University, where he graduated in 1987. He holds a Bachelor of Arts in Economics from George Washington University.
More Economy in Brief


