Haver Analytics
Haver Analytics

Featured Data Additions: May 2026

  • EMERGELAMexico → International Trade and Balance of Payments → Trade in Goods by Mode of Transportation

    Trade in goods by mode of transportation for Mexico was added to the EMERGELA database. A trade balance, exports and imports are available by mode of transportation such as by air, road, rail and sea. Monthly data are sourced from INEGI and start in January 2007.

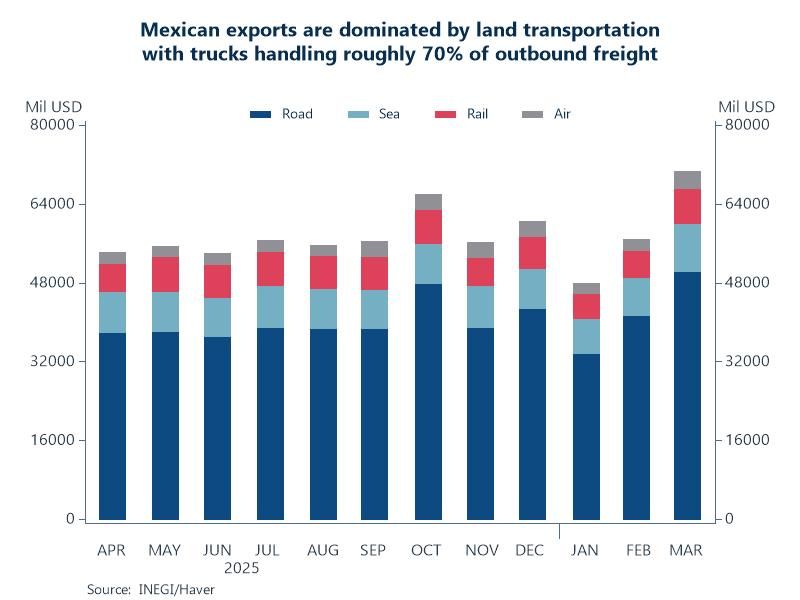
    Chart: Trucks remain the undisputed primary mode for Mexican exports, accounting for up to 70% of exports by value moving across its borders. The surge in just-in-time manufacturing, particularly automotive parts and electronics (like computers and semiconductors), heavily relies on the flexibility, speed, and point-to-point delivery of trucks. Sea freight, which accounts for roughly 15%, is mainly utilized for bulk commodities (such as crude oil and agricultural goods) as well as transcontinental exports.

  • UMSCA → Summary Consumer Sentiment Indexes → The Index of Consumer Sentiment by Tercile of Stock Wealth

    Indexes categorized by stock ownership were added to the UMSCA database, where the University of Michigan Survey of Consumers detail is housed. Indexes include consumer sentiment, current economic conditions, and consumer expectations. For each, series are available for the top third, middle third, and bottom third terciles of stock ownership, and also series for no stock holdings. Monthly data start in November 1998.

    Chart: Plotted are the sums of each ownership category for the three indexes along with the S&P 500. The optimism spread between the largest stock owners and people with lesser portfolios is currently at one of its widest points dating back to 1998. In fact, optimism for the bottom three ownership categories are currently at all-time lows. Not so coincidentally, the S&P 500 is hitting all-time highs, indicating that rising stock markets benefit consumers with the largest stock portfolios but leave behind consumers with smaller portfolios.

  • GLSECTOR → Competitiveness Measures → Bellwether Company Statistics → Meta Platforms, Inc

    Financial statistics for Meta Platforms Inc. were added to the GLSECTOR database. Meta is the conglomerate that owns Facebook, IG, WhatsApp and Threads and is also one of the main players in recent AI infrastructure investment. Available series include revenue, costs, income and capital expenditure. Quarterly data are sourced from Meta Platforms SEC filings and start in Q1 2012.

    Chart: The race to build AI infrastructure has escalated into one of the largest capex surges in history, with tech giants (Meta, Oracle, Amazon, Alphabet, Microsoft) investing heavily to build and secure infrastructure for Generative AI. This massive spending is driven by the urgent need for data center capacity, advanced AI-optimized chips, and energy infrastructure to handle surging demand. As a whole, these 5 companies have spent almost $1.5 trillion since Q1 2021 and in Q1 2026, capex totaled $179 billion, an increase of 96% YoY.

  • EMERGEMA → Ghana → National Accounts → Monthly Indicator of Economic Growth (MIEG)

    The Monthly Indicator of Economic Growth (MIEG) for Ghana was added to EMERGEMA. The MIEG is an economic statistic designed to provide early monthly signals on the direction of the economy ahead of the full quarterly GDP release. Indexes and YoY growth rates are available for the total economy and its three major sectors – agriculture, industry and services. Monthly data are sourced from the Ghana Statistical Service and start in January 2023.

    Chart: The economy expanded by 7.5% in January 2026 compared to the 8.2% recorded in January 2025. The data also show that all three major sectors of the economy recorded positive growth, pointing to continued broad-based economic momentum. The services sector was the standout performer recording growth of 9.6%, followed by industry at 7.2% and agriculture at 4.5%. These results suggest that Q1 GDP is likely to record moderate but steady growth, supported mainly by the services sector.

  • CNTRADE → Motor Vehicle Exports

    Motor vehicle exports detail for China was added to the CNTRADE database. These data, reported in number of vehicles, are available for 21 of China’s motor vehicle export markets. Monthly data are sourced from the China Passenger Car Association and start in April 2024.

    Chart: China is currently the world’s largest exporter of motor vehicles. Exports have increased by multiple factors, from under 1 million in 2020 to around 8 million in 2025, essentially increasing 7-8 times over 5 years. In 2025, the top countries importing cars from China were Mexico, Russia, and the UAE, with Mexico importing over 539,000 units. US tariffs and other restrictions have forced Chinese automakers to pivot, driving a massive surge in vehicle exports to alternative markets in Europe, Latin America, SE Asia and the Middle East.