 Global
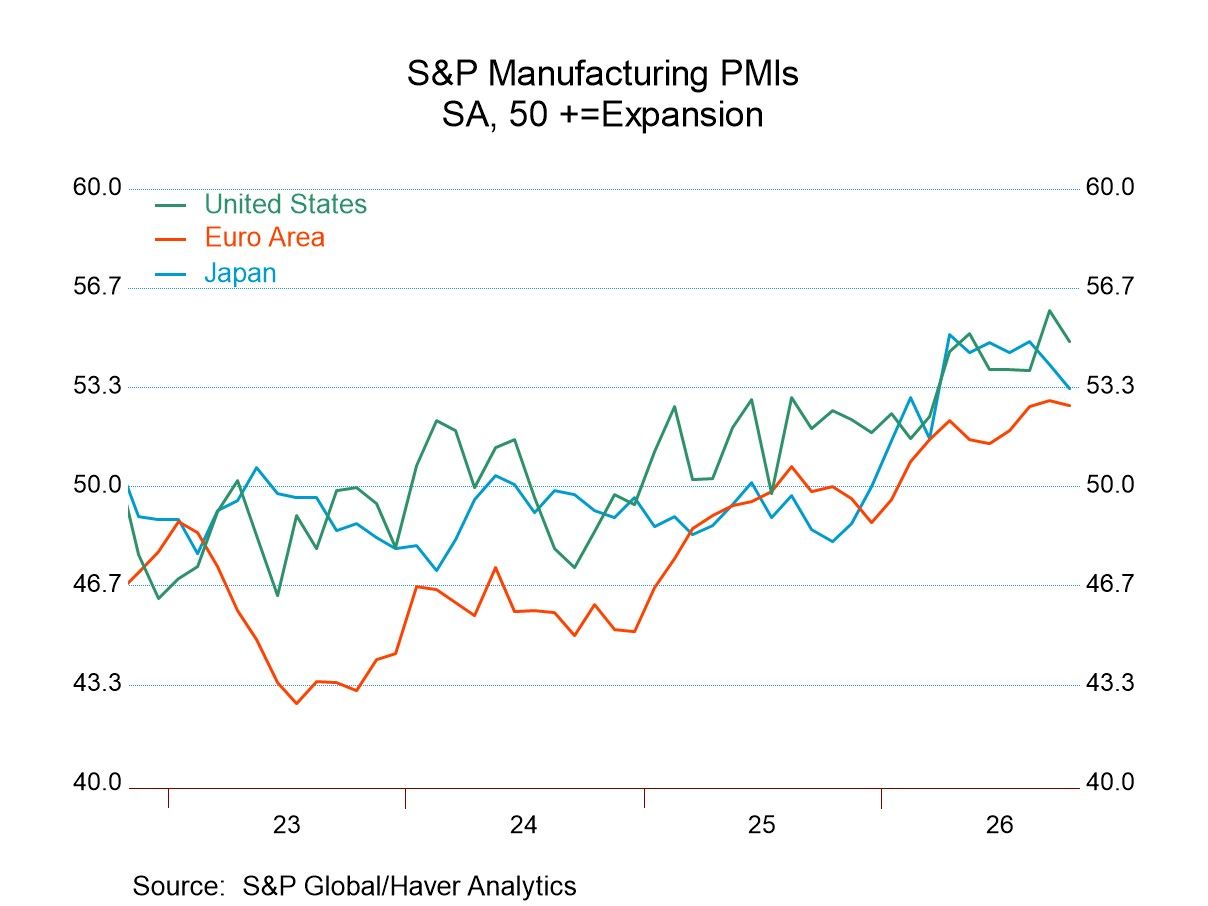
The PMI story for October shows PMIs weakening in 11 of the 18 countries that report manufacturing data. The manufacturing PMIs ticked down only slightly month-to-month, falling in 11 of eighteen reporters in October. The median reading over 12 months, six months, and three months progresses from 51.2 over 12 months to 52.2 over six months to 52.1 over three months. There's really not much change there to base a lot of analysis on; conditions have been substantially the same across this broad group of countries.
Sequentially the PMI data show that over three months 13 of the 18 early reporting countries have lower PMI values with only 5 showing better values. Over six months, six countries show worsening results with 12 showing improvement. Over 12 months, only four countries show worsening results with 14 showing improvement. As we look at the breadth of improvement versus deterioration from 12 months to six months to three months, there's a narrowing, a clear narrowing, in terms of the breadth of countries showing conditions getting better compared to those showing conditions getting worse. However, that statement also exists in the same world where the median for the group hasn't changed very much over any of those horizons.
Understanding this period – is it representative? To get a broader perspective, we can look at the rank or queue percentile standings that give us a percentile standing for each of the reporting countries or areas on data back to January 2021, a relatively broad period. However, it's not a time span in which activity was particularly strong. Still, using the EMU Commission readings on the EMU as a benchmark, the average back to 1990 shows the ranking of the current period average assessment has nearly normal average for the shorter period that makes the short period average seem representative in terms of the longer timeline as well. The reading for October is only 3% below the EMU mean on data back to 1990. So, the rankings over this period may also be a reasonable proxy for longer term rankings in the broadest sense.
There was some strength in the recovery and in the immediate post-COVID. And then there was the invasion of Ukraine that really knocked things back down. Subsequently there were U.S. tariffs imposed that created another international kerfuffle, and then the attack by Hamas on Israel, and the subsequent attempt to rein in Iran by the U.S. and Israel with significant knock-on effects that are largely still in place involving the difficulty for oil and other commodities to pass safely through the Strait of Hormuz. So, rankings on this timeline are not for a period of robust growth, but then that is not unusual, statistically. Part of that is that our period begins on a post-COVID high with activity having rebounded. The median percentile standing for this group on data back to January 2021 is a 67.2 percentile standing, which places it just barely into the top third of all observations on this timeline. Only three countries log percentile standings in the top 20% of all their observations during this span. They are Japan, Indonesia, and Malaysia, all Asian economies. The weakest readings on the period, at readings of around 25% and lower, include India at a 20.9 percentile standing, Turkey at a 22.4 percentile standing, and Brazil at a very weak 6th percentile standing. The grouping of these weakest economies includes two BRIC economies plus Turkey.
The large economies are doing well compared to their performance over this timeline, with the euro area economies having a 76.1 percentile standing, Germany, in particular, having a 76.1 percentile standing, the U.S. having a 79.1 percentile standing, the U.K. having a 73.1 percentile standing, and Japan having an 80.6 percentile standing. However, in contrast, France, with all of its fiscal trouble, has only a 53.7 percentile standing over the same period. Oil prices are shooting up again as the U.S. midterm elections draw near. There is a creeping rumor mill of commentary that suggests that the U.S. will be increasing hostilities against Iran after the midterm elections. That buzz has markets on edge and oil prices are moving higher again.