U.S. Factory Orders Unexpectedly Decline in June
Summary
- Factory orders -0.3% (+7.4% y/y) in June, second straight m/m decrease; still 14.0% above the Jan. ’24 low.
- Durable goods orders +0.5%, third m/m gain in four mths.; nondurable goods orders -1.2% and shipments -0.2%, first m/m declines since Nov.
- Mining, oil field & gas field machinery -27.2%, steepest m/m drop since Apr. ’16.
- Transportation orders -0.1%, led by m/m falls of 7.2% in defense aircraft orders and 3.9% in ships & boats.
- Unfilled orders +0.6%, 11th straight m/m rise.
- Inventories +0.1%, eighth consecutive m/m increase.
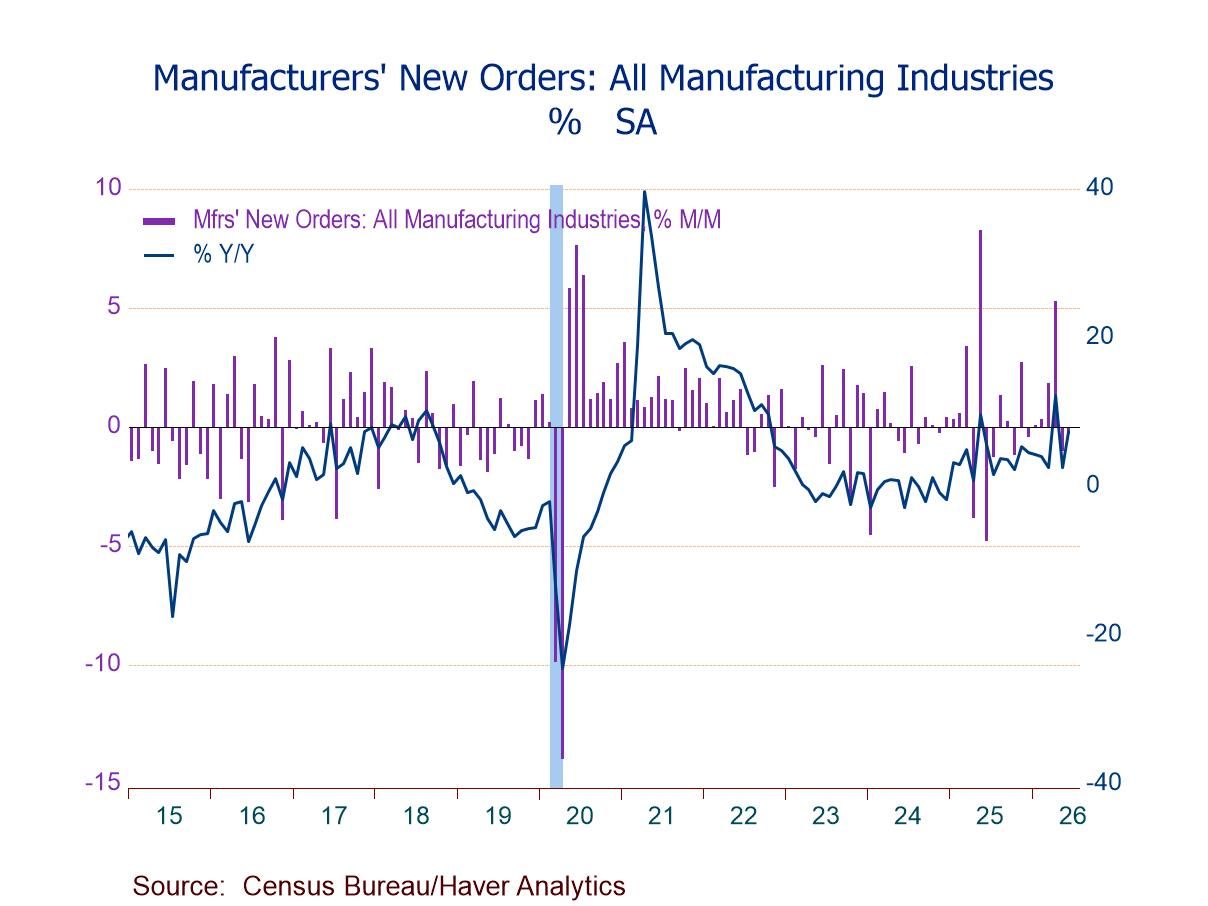
Total factory orders unexpectedly fell 0.3% m/m in June following a 1.1% decline in May and a 5.3% advance in April, according to data from the U.S. Census Bureau. The Action Economics Forecast Survey had expected a 0.4% m/m June increase. The year-on-year growth rate accelerated to 7.4% in June from 2.5% in May (+5.6% in June 2025), while remaining far below the April 2021 peak of 39.6%. Factory orders excluding defense fell 0.4% (+6.5% y/y) following a 1.1% May decline and four successive m/m gains. Factory orders excluding the transportation sector slid 0.4% (+8.8% y/y), the first m/m slide in eight months, after a 2.0% May increase.
Notably, orders for mining, oil field & gas field machinery plunged 27.2% (+27.1% y/y) in June, the first m/m fall in three months and the deepest since April 2016, reversing an 11.0% gain in May. Orders for defense aircraft & parts dropped 7.2% (+46.9% y/y) in June after increasing 8.9% in May and 2.4% in April, and orders for ships & boats fell 3.9% after rising 3.5% and 5.0% in the prior two months, while orders for nondefense aircraft & parts rose 3.7% following a 51.1% May plunge and a 167.4% April surge.
Durable goods orders rose 0.5% (7.6% y/y) in June after a 4.0% drop in May (revised up slightly from +0.3% m/m in the advance report on July 27), marking the third m/m gain in four months. The June m/m rise was led by a 3.2% advance (16.8% y/y) in computers & electronic products, followed by increases of 1.6% (7.6% y/y) in electrical equipment, appliances & components, 1.3% (17.8% y/y) in primary metals, and 0.3% (14.8% y/y) in machinery. In contrast, durable goods orders for fabricated metal products (-0.6%; +10.7% y/y), furniture & related products (-0.4%; +1.1% y/y), and transportation equipment (-0.1%; +1.2% y/y) declined m/m in June.
Nondurable goods orders, which equal nondurable goods shipments, fell 1.2% (+7.1% y/y) in June, the first m/m fall since November, after a 2.2% increase in May. The June m/m decline was led by a 6.3% drop (+21.8% y/y) in petroleum & coal products, followed by decreases of 1.6% (+0.7% y/y) in textile products, 0.8% (+8.8% y/y) in apparel, 0.4% (-3.3% y/y) in textile mills, and 0.1% (-2.9% y/y) in printing. To the upside, the following nondurable goods shipments rose m/m in June: leather & allied products (+4.9%; -2.7% y/y), plastics & rubber products (+0.7%; +3.6% y/y), food products (+0.4%; +1.4% y/y), paper products (+0.3%; +2.4% y/y), beverage & tobacco products (+0.1%; +2.0% y/y), and chemical products (+0.1%; +8.3% y/y).
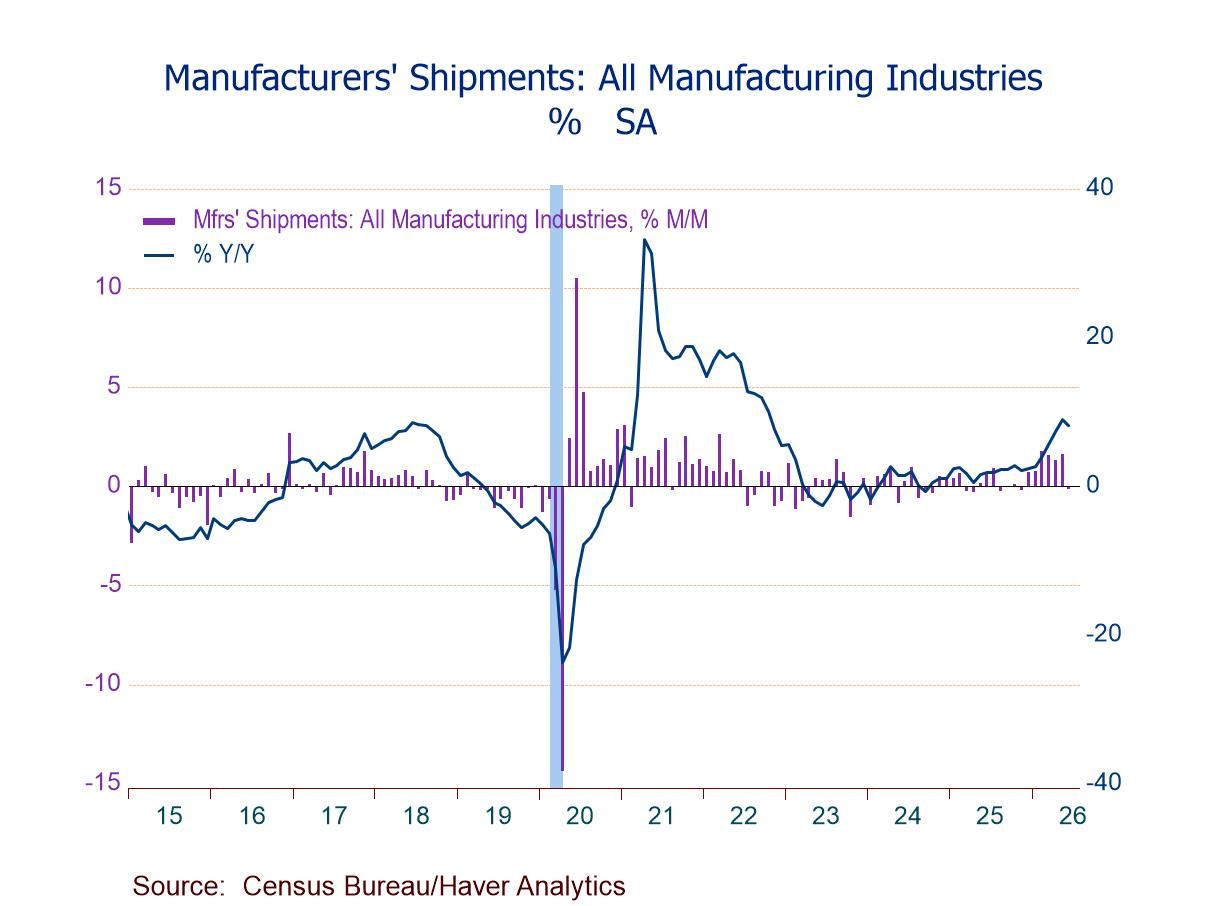
Total shipments fell 0.2% (+8.2% y/y) in June, the first m/m decline since November, after increases of 1.6% in May and 1.3% in April. Excluding transportation, shipments fell 0.3% (+7.6% y/y), the first m/m fall since October, following a 1.6% May gain. Shipments of durable goods industries rose 0.8% (9.1% y/y), the seventh straight m/m increase, after a 1.1% May rise. This reflected m/m gains in almost all durable goods shipments categories, led by a 2.5% advance (9.6% y/y) in computers & electronic products, alongside rises of 1.8% (10.0% y/y) in machinery, 1.0% (7.2% y/y) in electrical equipment, appliances & components, 1.0% (6.5% y/y) in miscellaneous durable goods, 0.8% (15.5% y/y) in primary metals, 0.6% (7.8% y/y) in fabricated metal products, 0.4% (10.8% y/y) in transportation equipment, and 0.4% (2.2% y/y) in wood products. In contrast, durable goods shipments for furniture & related products (-0.5%; +1.0% y/y) and nonmetallic mineral products (-0.5%; +2.7% y/y) fell m/m in June.
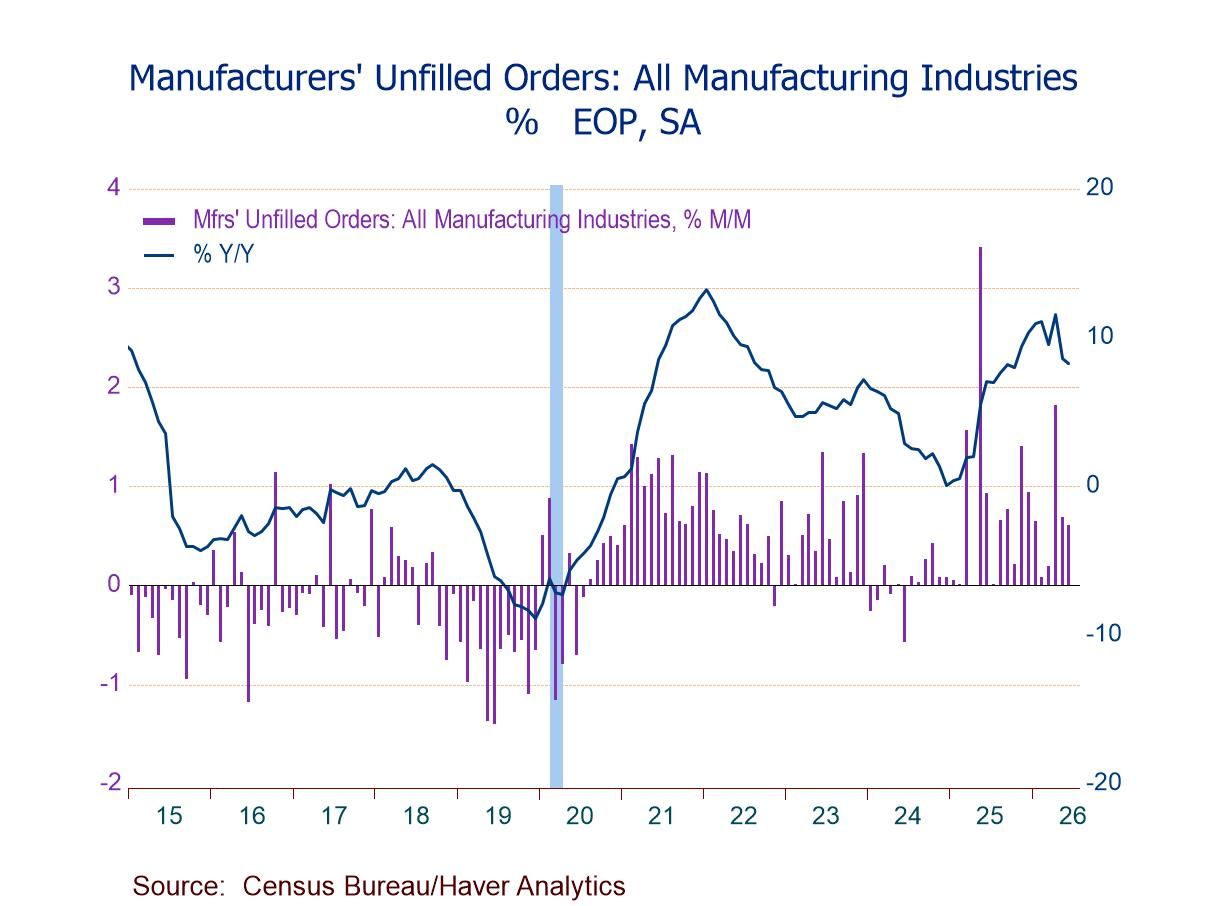
Unfilled orders rose 0.6% (8.3% y/y) in June, the 11th consecutive m/m rise, following a 0.7% increase in May. Excluding transportation, unfilled orders climbed 0.9% (5.4% y/y), also up for the 11th straight month, after a 1.1% May rise. Backlogs of durable goods grew 0.6% (8.3% y/y) in June, driven by gains of 1.6% (6.5% y/y) in primary metals, 1.1% (6.0% y/y) in machinery, and 1.0% (5.0% y/y) in computers & electronic products, partially offset by a 0.4% decline (-2.1% y/y) in furniture & related products.
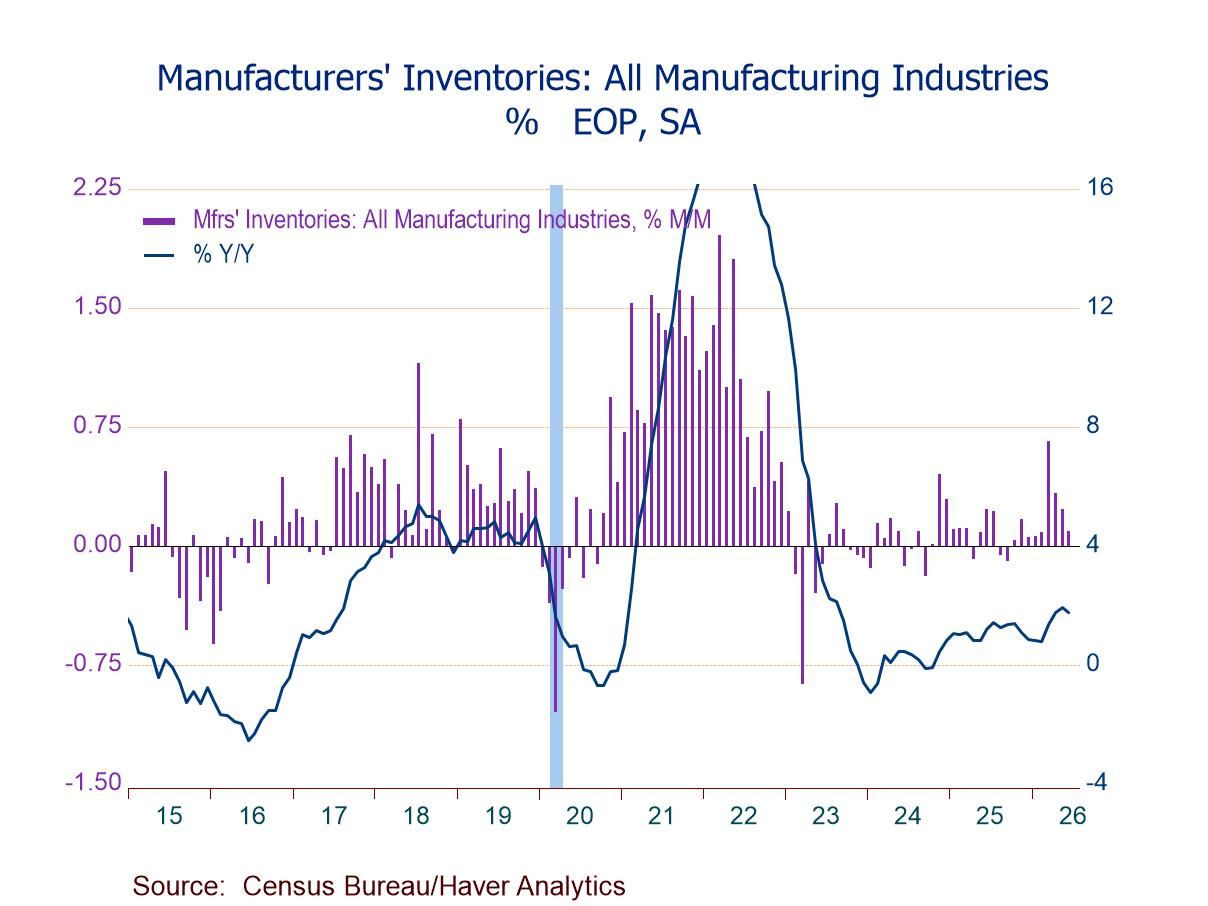
Inventories edged up 0.1% (1.8% y/y) in June, the eighth successive m/m increase, after a 0.2% rise in May. Excluding transportation, inventories were virtually unchanged m/m (+1.9% y/y) following four consecutive m/m gains. Durable goods inventories rose 0.3% (2.2% y/y) in June, the ninth straight m/m rise, after a 0.1% uptick in May, while nondurable goods inventories fell 0.3% (+1.1% y/y), the first m/m decrease since January, following a 0.4% May increase.
The factory sector data are available in Haver’s USECON database. The Action Economics Forecast Survey is in the AS1REPNA database.

Winnie Tapasanun
AuthorMore in Author Profile »Winnie Tapasanun has been working for Haver Analytics since 2013. She has 20+ years of working in the financial services industry. As Vice President and Economic Analyst at Globicus International, Inc., a New York-based company specializing in macroeconomics and financial markets, Winnie oversaw the company’s business operations, managed financial and economic data, and wrote daily reports on macroeconomics and financial markets. Prior to working at Globicus, she was Investment Promotion Officer at the New York Office of the Thailand Board of Investment (BOI) where she wrote monthly reports on the U.S. economic outlook, wrote reports on the outlook of key U.S. industries, and assisted investors on doing business and investment in Thailand. Prior to joining the BOI, she was Adjunct Professor teaching International Political Economy/International Relations at the City College of New York. Prior to her teaching experience at the CCNY, Winnie successfully completed internships at the United Nations. Winnie holds an MA Degree from Long Island University, New York. She also did graduate studies at Columbia University in the City of New York and doctoral requirements at the Graduate Center of the City University of New York. Her areas of specialization are international political economy, macroeconomics, financial markets, political economy, international relations, and business development/business strategy. Her regional specialization includes, but not limited to, Southeast Asia and East Asia. Winnie is bilingual in English and Thai with competency in French. She loves to travel (~30 countries) to better understand each country’s unique economy, fascinating culture and people as well as the global economy as a whole.
More Economy in Brief
 Global| Sep 23 2026
S&P PMIs Five of Seven Early Reporters Show Stronger Output in September
U.K. Housing Surveys and Consumer Sentiment Support the View of Weak Growth