U.S. Business Sales and Inventories Rose in July
by:Sandy Batten
|in:Economy in Brief
Summary
- Total business inventories increased 0.2% m/m in July with increases across sectors.
- Total business sales climbed 1.0% m/m in July, their largest monthly gain since February.
- With sales advancing more than inventories, the inventory/sales ratio fell to 1.37, its lowest reading since July 2022.
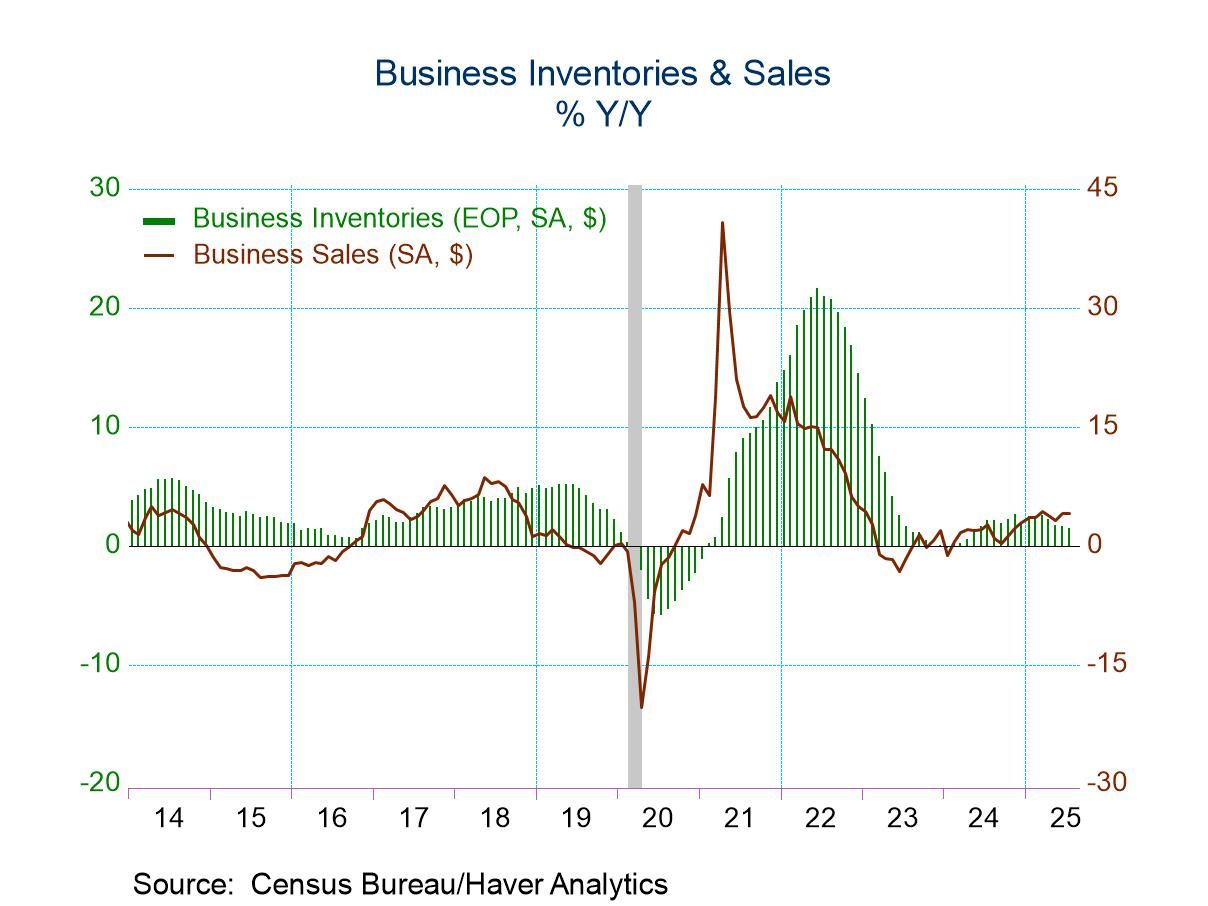
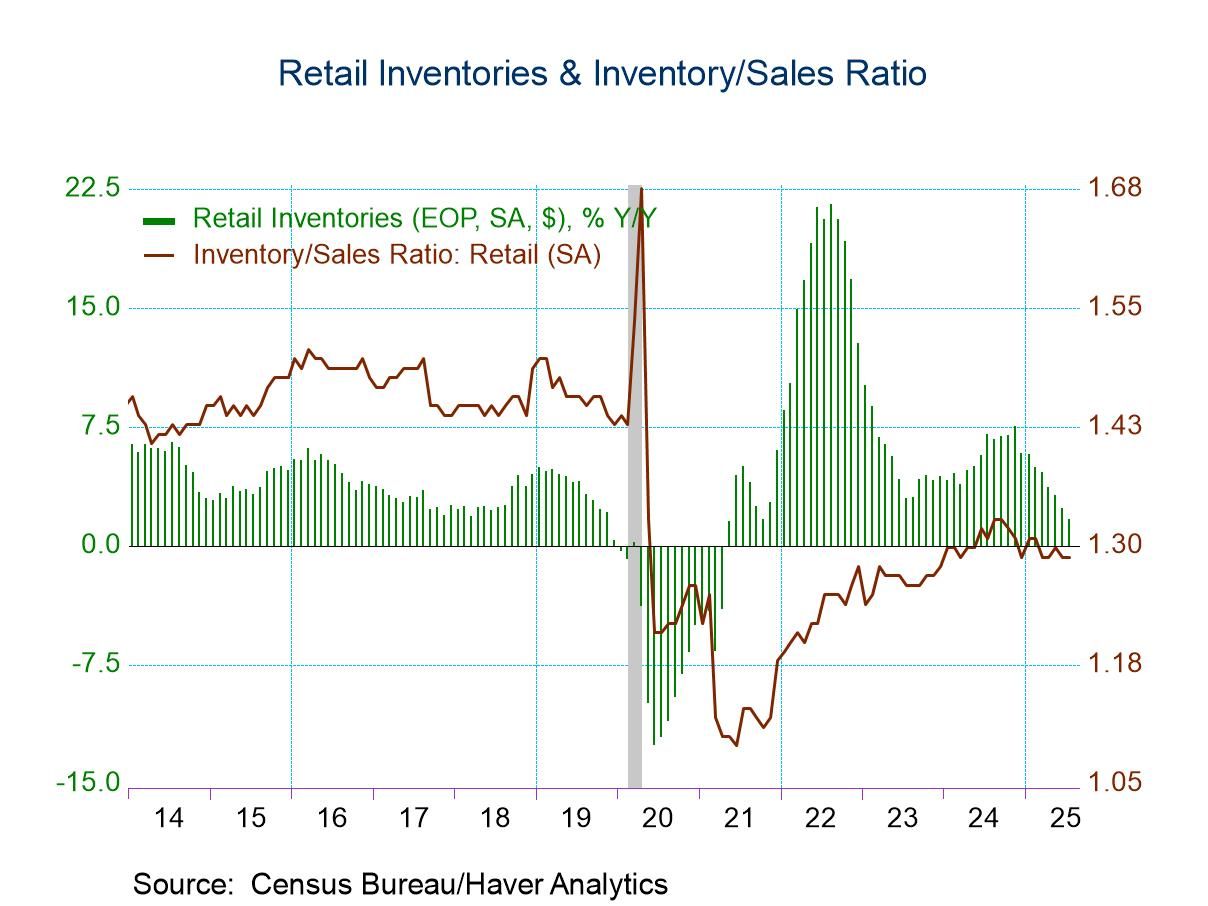
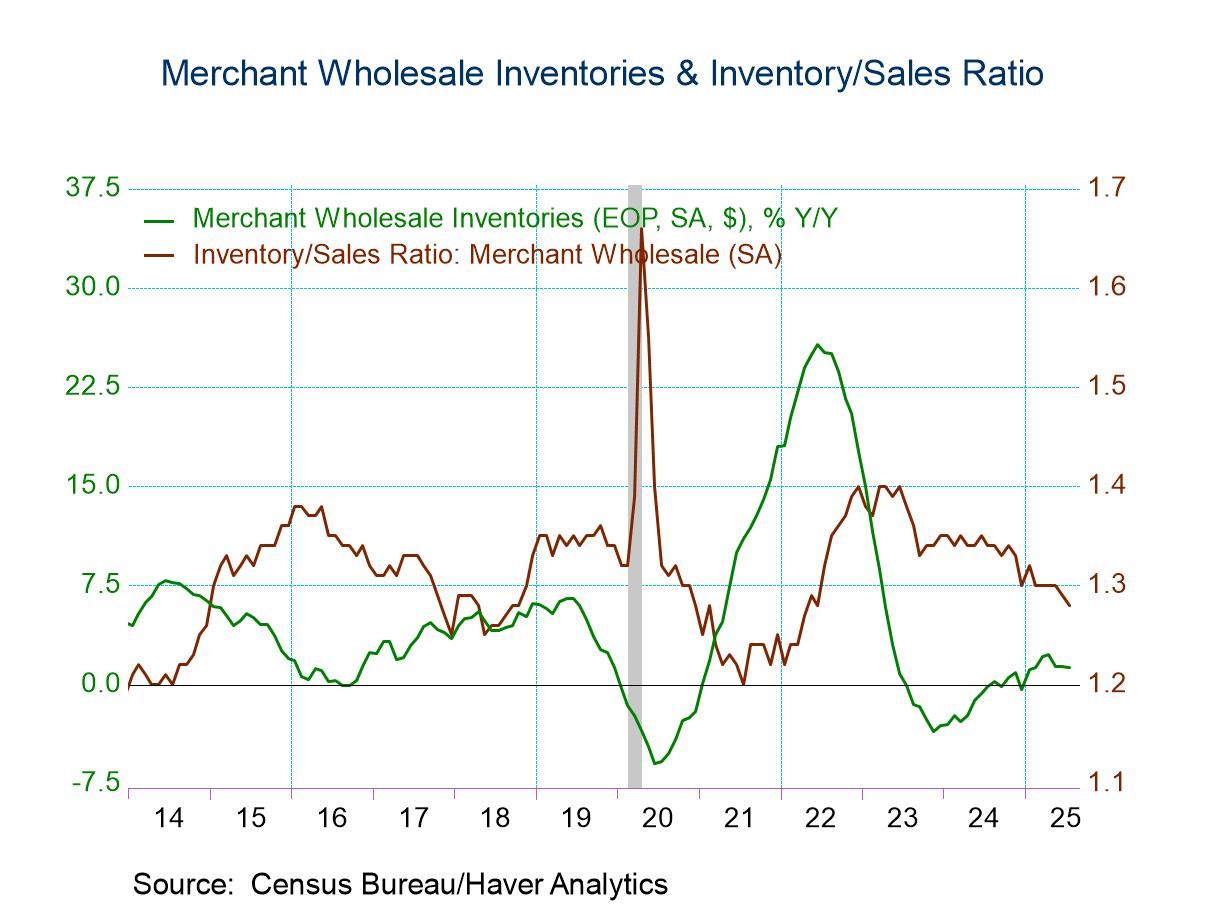
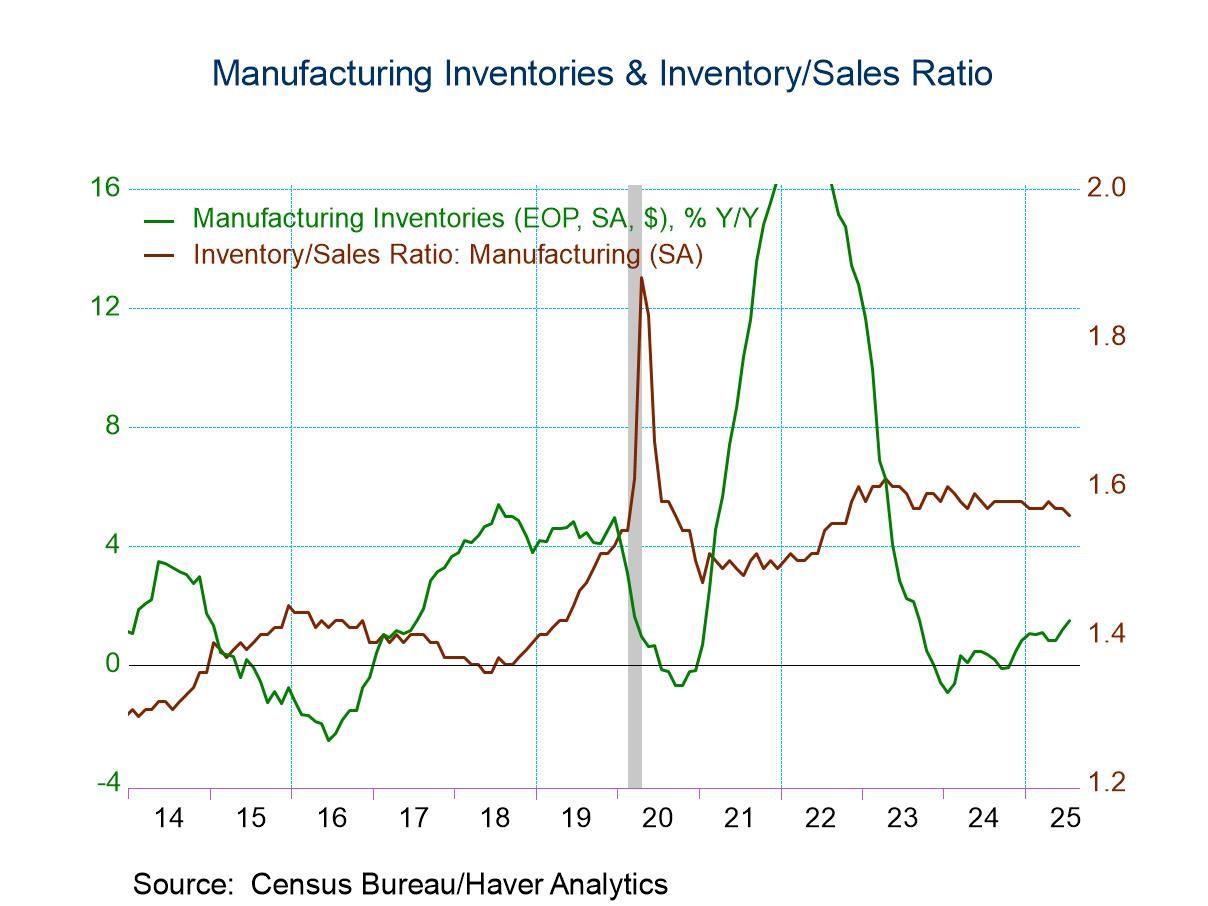
Total business inventories increased 0.2% m/m (1.5% y/y), the same monthly gain as in June. The y/y gain has decelerated from a recent high of 2.6% in November 2024. Retail inventories rose 0.2% m/m for the third straight month and the y/y increase slowed further to 1.7% in July from 2.4% in June. Factory inventories rose 0.3% m/m (1.5% y/y) in July, their largest monthly gain since December. Wholesale inventories edged up 0.1% m/m (1.3% y/y) in July following a 0.2% monthly gain in June.
Within the retail sector, monthly gains were widespread. Food and beverage inventories jumped 0.6% m/m in July. Auto inventories increased 0.5% m/m, while retail inventories excluding autos edged up 0.1% m/m. Furniture store inventories and building materials inventories each rose 0.4% m/m. In contrast, clothing inventories slid 0.2%, and general merchandise store inventories declined 0.3% m/m in July.
Total business sales increased 1.0% m/m (4.0% y/y) in July, their largest monthly gain since February. Retail sales rose 0.7% m/m (3.8% y/y) in July with widespread gains across sectors. Separately, in another report released this morning, retail sales rose a larger-than-expected 0.6% m/m in August. Factory shipments increased by a solid 0.9% m/m (1.8% y/y) in July, their largest monthly gain since July 2024. Wholesale sales jumped 1.4% m/m (6.2% y/y), their largest monthly gain since February.
With the rise in sales outpacing the increase in inventories, the total business inventory/sales ratio edged down to 1.37, its lowest reading since July 2022. The retail I/S ratio was unchanged at 1.29. The factory I/S ratio fell to 1.56, its lowest reading since October 2022. The wholesale I/S edged down to 1.28 in July, its lowest reading since June 2022.
The manufacturing and trade data are in Haver’s USECON database. The Action Economics Forecast Survey is in the AS1REPNA database.

Sandy Batten
AuthorMore in Author Profile »Sandy Batten has more than 30 years of experience analyzing industrial economies and financial markets and a wide range of experience across the financial services sector, government, and academia. Before joining Haver Analytics, Sandy was a Vice President and Senior Economist at Citibank; Senior Credit Market Analyst at CDC Investment Management, Managing Director at Bear Stearns, and Executive Director at JPMorgan. In 2008, Sandy was named the most accurate US forecaster by the National Association for Business Economics. He is a member of the New York Forecasters Club, NABE, and the American Economic Association. Prior to his time in the financial services sector, Sandy was a Research Officer at the Federal Reserve Bank of St. Louis, Senior Staff Economist on the President’s Council of Economic Advisors, Deputy Assistant Secretary for Economic Policy at the US Treasury, and Economist at the International Monetary Fund. Sandy has taught economics at St. Louis University, Denison University, and Muskingun College. He has published numerous peer-reviewed articles in a wide range of academic publications. He has a B.A. in economics from the University of Richmond and a M.A. and Ph.D. in economics from The Ohio State University.
More Economy in Brief


 Global