Observations about Economic Performance and Stock Market Valuations
|in:Viewpoints
The U.S. financial headlines focus on high stock market valuations, questioning them as too high, the concentrations of capitalizations, questioning them as excessive, and big cap AI companies that are getting bigger and going public at higher capitalizations. Here’s a few economic observations on these trends and an international comparison.
The economy. The U.S. economy has been quite resilient to recent shocks—erratic tariffs policies and the surge in oil prices--and continues to expand. Economic growth has been driven by consumer spending and solid gains in business investment while residential investment has weakened and subtracted from growth. Currently, while the ongoing Middle East conflict and high oil prices and tariffs are weighing on consumer pocketbooks, and real disposable income has fallen in each of the last three months ((Feb-Mar-April), households have reduced their rates of personal saving to smooth real consumption. Nominal GDP, the broadest measure of current dollar spending and aggregate demand, has risen 6% in the last year and at a 5% annualized pace in the last two quarters. Sustained high energy prices are likely to adversely impact real consumption.
Real interest rates remain moderate, the economy and the probability of recession is low. Of note, history, at least going back to the 1950s, shows that the S&P500 continues to rise and does not peak until just before recession.
Profits. Corporate profits are rising briskly, much faster than GDP (Chart 1). That’s also typical during economic expansions. Operating profits have risen 18.7% in the last two years and are up 63.3% since 2019, just before Covid. During those same two periods, nominal GDP rose 10.8% and 47.7%, respectively.
Chart 1. Corporate Operating Profits and GDP, 2018=100
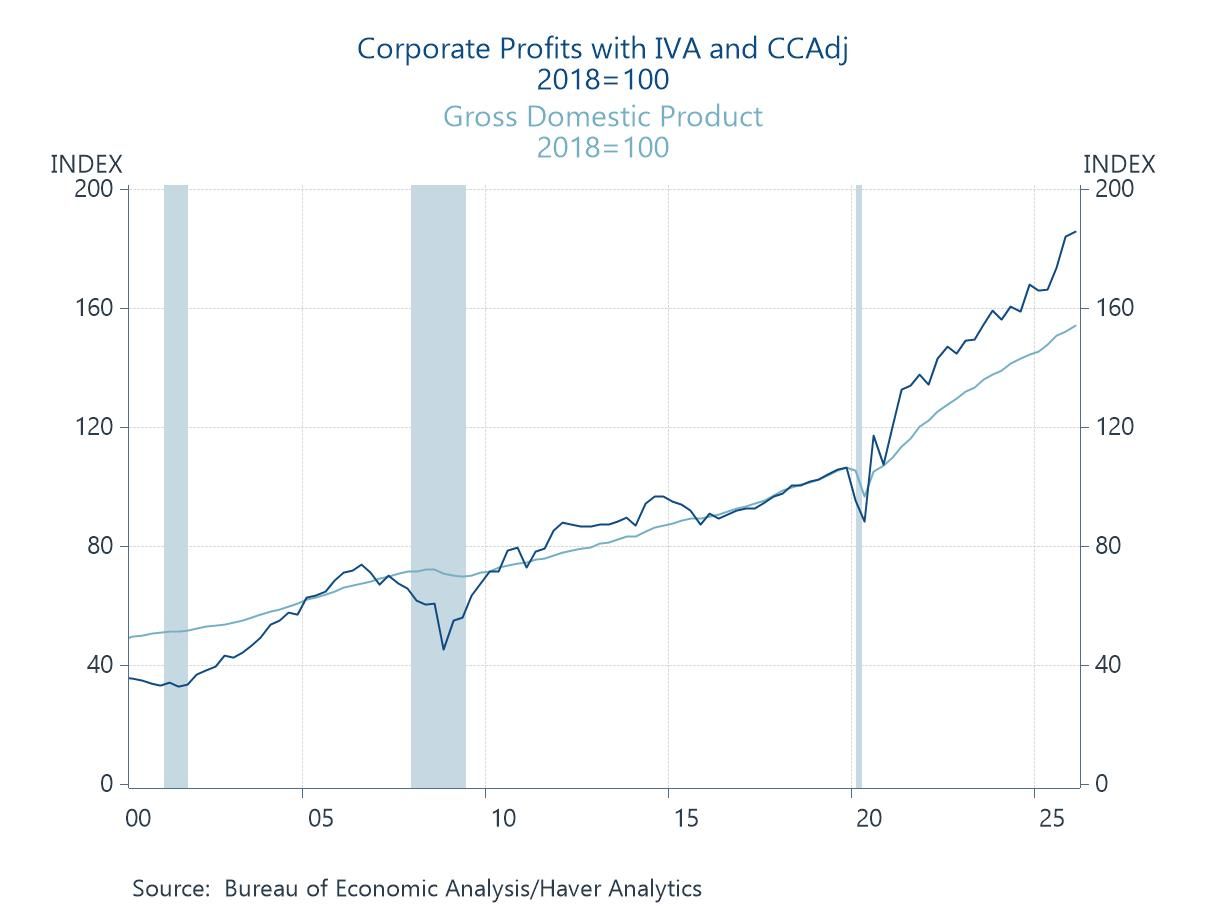
There are several reasons why profits outpace GDP during expansions and fall more during recessions. Margins widen and volumes expand (shrink) as aggregate demand fluctuates over the business cycle; capital spending is cyclical and affects business efficiencies; and GDP measures domestic production while profits are buoyed by U.S. firms’ overseas activities not counted in GDP (for example, most of the value of Apple computers and iPhones produced overseas is not measured in GDP, although global transfer pricing makes accurate calculations very difficult, and the value of those products of U.S. firms produced overseas and purchased by U.S. consumers nets out to zero in GDP, adjusted for accounting, exclusive of leasing agreements and revenues/profits from apps). Of note, around 50% of revenues of Microsoft, Alphabet and Nvidia are generated overseas while Meta’s and Apple’s are higher, 63%, and Amazon’s are lower, 31%. Also, in recent years, the revenues of AI firms are rising dramatically, and their profit margins are very high.
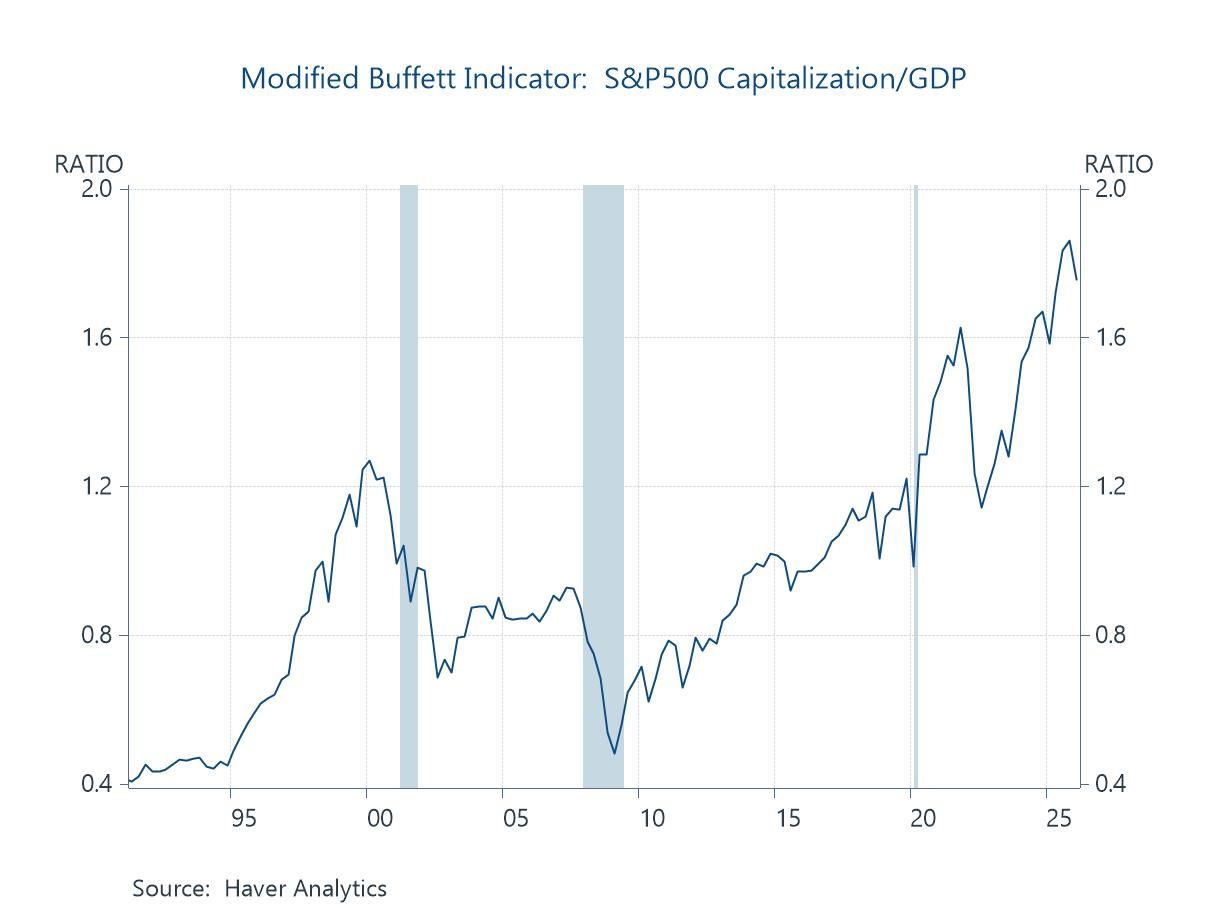
Stock market valuations reflect expected profits. The continued economic expansion and upward trajectory of profits support expectations of rising future profits. The “Buffet Indicator”, which assesses whether stock market valuations are cheap or rich based on the ratio of stock market capitalization to GDP overstates concerns about excess valuations since profits have risen much more than GDP. Market valuations relative to profits are higher than normal but much more reasonable than suggested by the Buffett Indicator (Charts 2a and 2b).
Chart 2a. S&P500 Capitalization/Profits
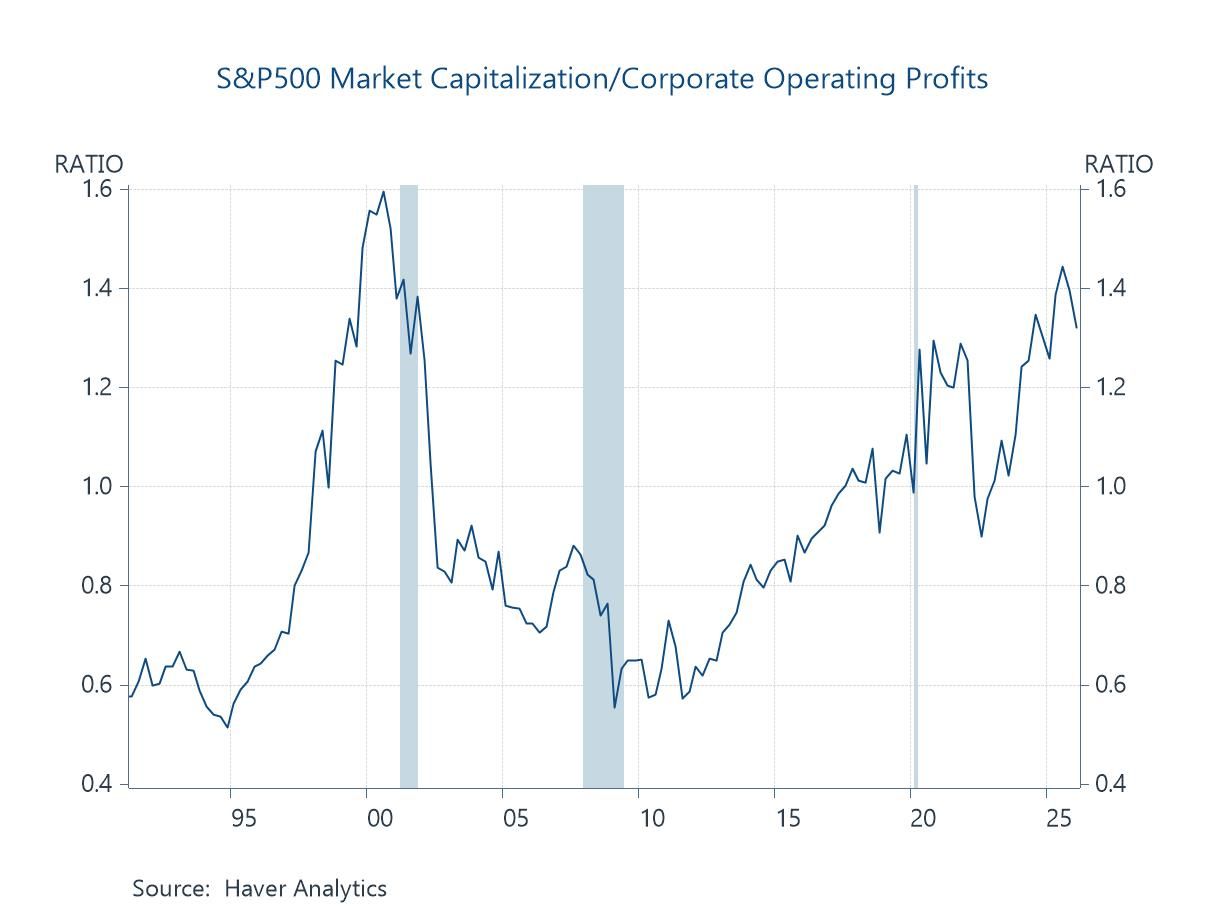
Chart 2b. S&P500 Capitalization/GDP
The critical question is whether expectations of future profits are achievable. The speed and magnitude of the emergence of big cap AI—the spreading use, paid subscribers and revenues, and capital spending plans and outlays—is truly profound. Whether the leading firms continue to meet market expectations, and their ability to manage expectations, is the overwhelming question of this era.
Concentration of capitalization. The Magnificent 7 (Apple, Microsoft, Alphabet, Amazon, Nvidia, Meta and Tesla) account for approximately 35% of the entire S&P500 capitalization. The concentration of profits is also pronounced but not as high.
Investors tend to concentrate their portfolios in the growth companies of the day. That’s always been the case: the desire to own the leading-edge growth companies results in the concentration of stock market capitalization. The trend in technological innovations is not linear, rather leading innovations are sporadic and come in bunches (Valerie Ramey, “Secular stagnation or technological lull?” Journal of Policy Modeling, February 2020). This affects trends in economic performance, capital spending, profits and expectations. The spurt in innovations now implemented into commerce and society that is now underway is boosting productivity, economic growth, business investment and profits, and generating increases in wealth.
In 2018, the FAANG stocks (Facebook/Meta, Amazon, Apple, Netflix, Google/Alphabet) collectively accounted for 15% of the S&P500. In the first half of 2018, they generated 98% of the S&P500’s total returns. In the mid-1960s, the “Nifty-Fifty” represented roughly 30%-40% of the S&P500 capitalization, and the top 10 stocks dominated total market value and traded at an average P/E of 42. During the dot.com bubble of the late-1990s, capitalization concentrations remained reasonable low, as the surge in stock values was widespread across many small firms.
What happened following these episodes? The valuations of the Nifty-fifty and the overall stock market faltered and lost value in the second half of the 1960s as inflation and interest rates rose sharply (inflation rose from 1.5% in 1965 to 5.8% in 1970 and the Fed hiked interest rates from 4.1% to 8.9% in late 1969), and then unraveled in the early 1970s as misguided economic policies (wage and price controls, et al) and the oil price shock of 1973 (along with monetary accommodation) drove up inflation and clobbered economic performance and profits. Technological innovations and new products superseded some of the firms in the Nifty-fifty, and they faded from the economic landscape.
The dot.com bubble burst following Fed rate increases (after Y2K) in the first half of 2000 and the failure of high-flying businesses to generate revenues and profits sufficient to merit their high valuations. The pattern of the FAANG’s stock valuations following their emergence is more nuanced: overall they continued to outperform the S&P500 in 2019 (as Apple and Facebook outperformed while Amazon and Netflix “faltered”—they rose but not as fast as the S&P500), fell sharply during Covid in the first half of 2020, and then rebounded dramatically to new highs in the 2020s.
The bottom line is history is marked by occasional spurts in technological innovations, and the leading-edge growth companies of the day attract concentrations of market capitalization. The subsequent and ultimate stock market behavior of the companies depends on company revenues, profits and whether they meet market expectations, and macroeconomic fundamentals.
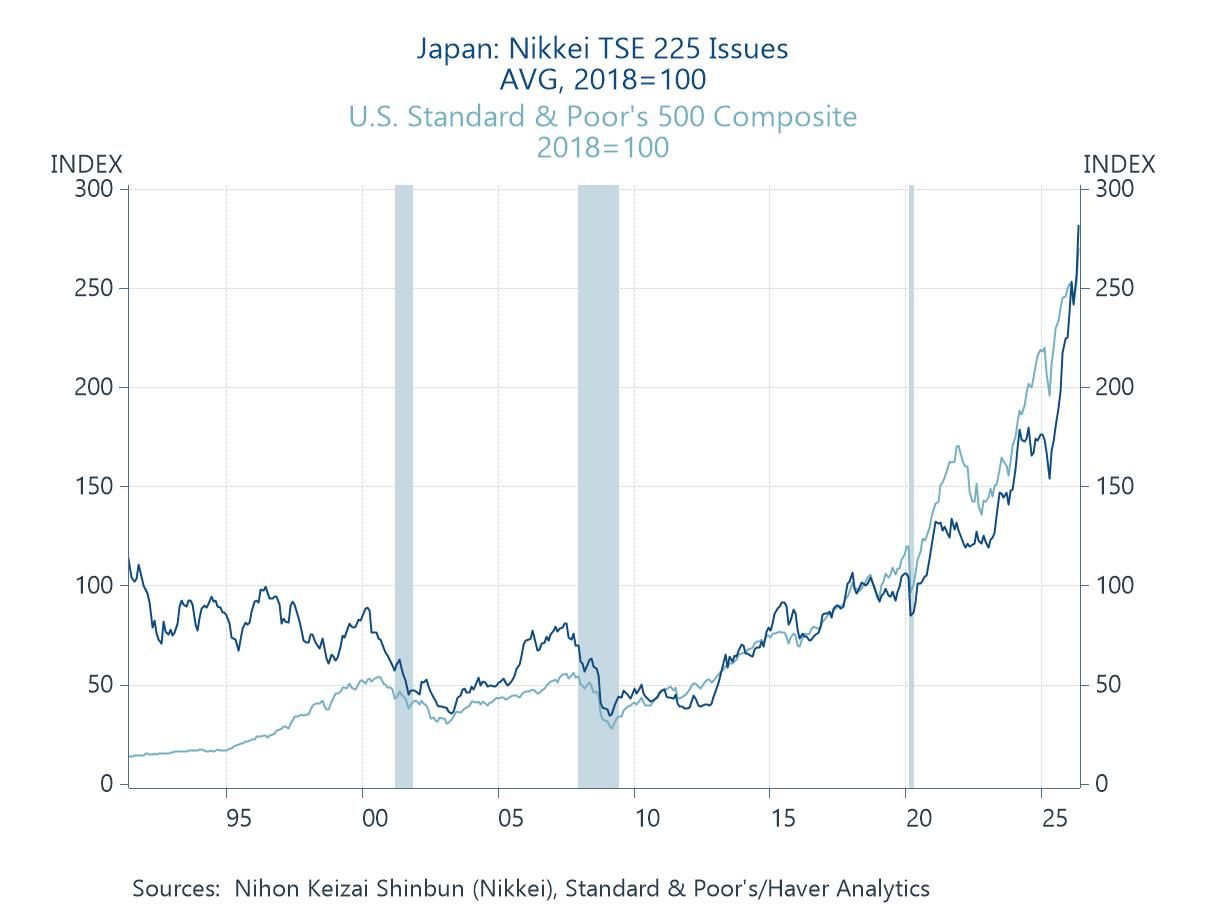
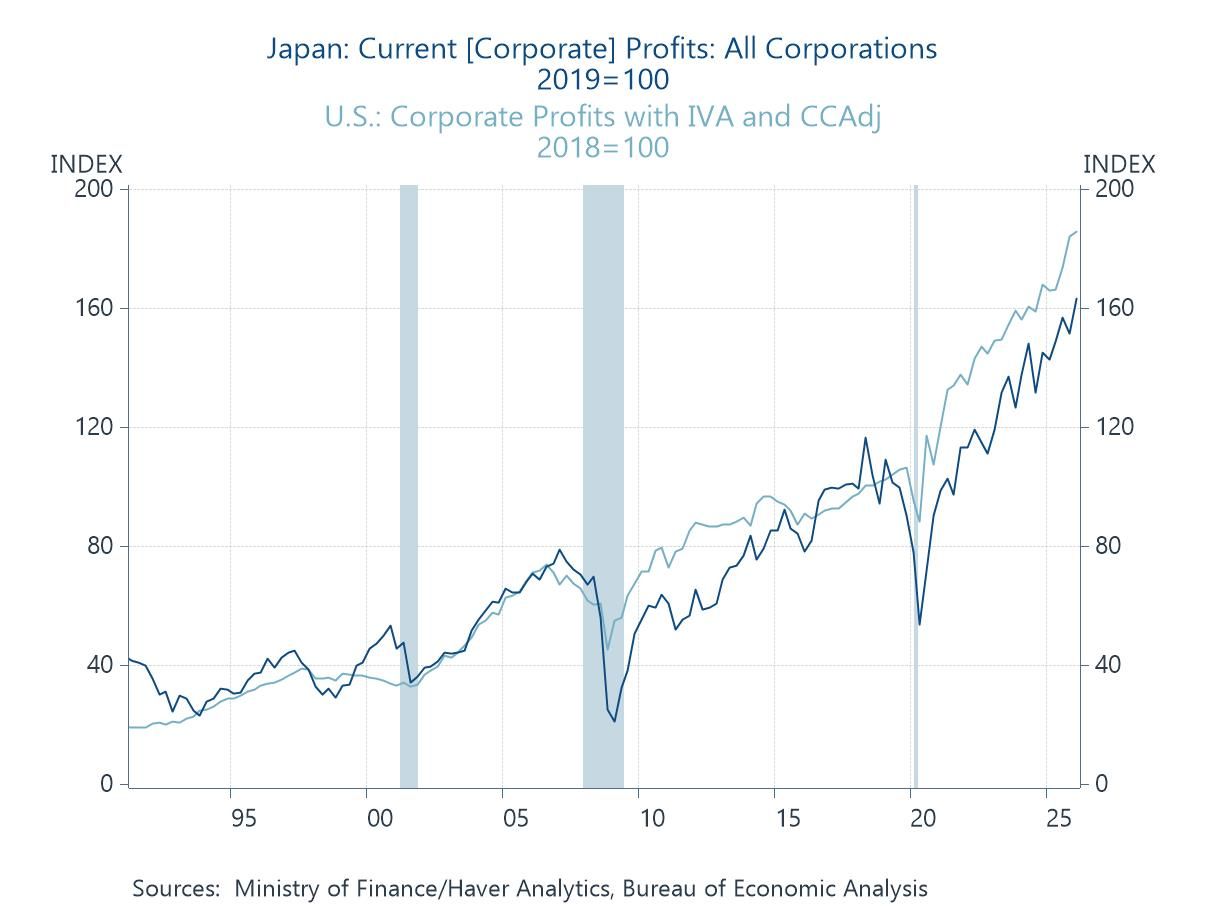
Japan’s Nikkei is outpacing the U.S. S&P500. While the S&P500 and its Magnificent 7 capture so many headlines, Japan’s Nikkei has appreciated faster since 2024, fueled by faster growth in corporate profits and a dramatic catch up in valuations (Chart 3). Since year-end 2024 through April 2026, the Nikkei has appreciated 59%, twice the S&P500’s strong appreciation of 28.9%. Since year-end 2019 just before Covid, the Nikkei has appreciated 265%, outpacing the S&P500’s 235%. Corporate profits fell dramatically more in Japan during Covid but have risen faster since mid-2020 (Chart 4).
Chart 3. Nikkei Topix and S&P500, 2018=100
The U.S. economy is growing faster than Japan, benefiting from healthy gains in consumption and AI-driven business investment. While exports are a higher share of GDP in Japan (18.2%) than in the U.S. (11.2%), both nation’s corporations’ profits benefit significantly from overseas production and activities.
Chart 4. Corporate Profits in U.S. and Japan, 2019=100
The Nikkei 225’s concentration is higher. The Nikkei 225 index is far more concentrated in a smaller number of firms than the S&P500. However, the Nikkei’s capitalization is based on each corporation’s price rather than market capitalization. By this method, the top 10 companies on the Nikkei account for nearly 48% of the index’s total value. Similar with the S&PP500, the Nikkei’s performance relies very heavily on hi-tech and AI firms.
Concluding remarks. This period of dramatic AI innovation and development that has generated higher stock market valuations and concentrations of capitalization has similarities to earlier periods of spurts in innovations. Past innovations contributed to higher standards of living and increases in wealth. Current risks are obvious, particularly if the trajectory of revenues and profits of the big cap AI firms fail to meet market expectations. But history suggests that innovation-driven profits and concentration of higher valuations do not necessarily lead to subsequent market reversals, and the outlook for economic performance remains positive.

Mickey D. Levy
AuthorMore in Author Profile »Mickey Levy is a macroeconomist who uniquely analyzes economic and financial market performance and how they are affected by monetary and fiscal policies. Dr. Levy started his career conducting research at the Congressional Budget Office and American Enterprise Institute, and for many years was Chief Economist at Bank of America, followed by Berenberg Capital Markets. He is a Visiting Fellow at the Hoover Institution at Stanford University and a long-standing member of the Shadow Open Market Committee.
Dr. Levy is a leading expert on the Federal Reserve’s monetary policy, with a deep understanding of fiscal policy and how they interact. He has researched and spoken extensively on financial market behavior, and has a strong track record in forecasting. Dr. Levy’s early research was on the Fed’s debt monetization and different aspects of the government’s public finances. He has written hundreds of articles and papers for leading economic journals on U.S. and global economic conditions. He has testified frequently before the U.S. Congress on monetary and fiscal policies, banking and credit conditions, regulations, and global trade, and is a frequent contributor to the Wall Street Journal.
He is a member of the Council on Foreign Relations and the Economic Club of New York, and previously served on the Panel of Economic Advisors to the Federal Reserve of New York, as well as the Advisory Panel of the Office of Financial Research.
Dr. Levy holds a Ph.D. in Economics from University of Maryland, a Master’s in Public Policy from U.C. Berkeley, and a B.A. in Economics from U.C. Santa Barbara.