 Global| Feb 26 2026
Charts of the Week: The AI Undercurrent
by:Andrew Cates
|in:Economy in Brief
Summary
Over the past few days, financial markets have been navigating a fresh wave of policy and geopolitical cross-currents, with the US Supreme Court ruling on executive tariff authority adding a new layer of uncertainty to the trade outlook. At the same time, the AI investment boom continues to provide an important cyclical tailwind, even as investors remain alert to valuation risks, while renewed tensions involving Iran have reintroduced an energy risk premium. Against that backdrop, this week’s charts paint a picture of a global economy that is still expanding but becoming more differentiated. Latest flash PMI surveys confirm that global activity remains in growth territory despite some cooling in the US (chart 1). Strong semiconductor exports from Korea (chart 2) and surging US data-centre investment (chart 3) both underscore the continued force of the AI capex cycle, while a strong pickup in German capital goods orders (chart 4) hints at a more traditional, policy-linked investment impulse emerging in Europe. Meanwhile, the tight co-movement between oil prices and US front-end yields highlights (chart 5) the ongoing macro sensitivity to energy markets, and the recent downward drift in Japanese government bond yields — alongside softer data surprises — suggests that global bond markets may be receiving at least a modest anchoring impulse from Japan (chart 6).
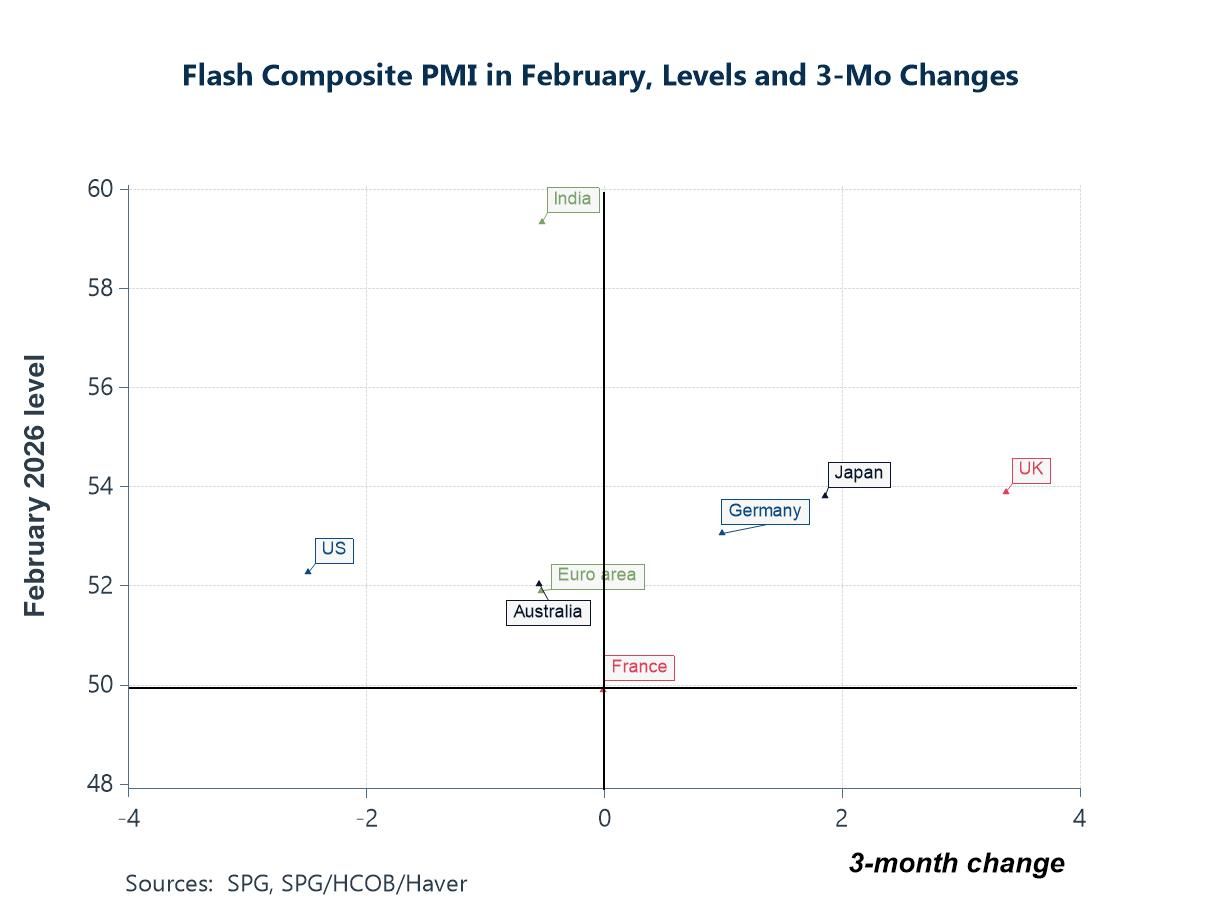
The Global Business Cycle The latest flash composite PMI readings reinforce the theme of a still-expanding but increasingly uneven global cycle. As the chart shows, activity remained in expansion territory across most major economies in February, with the UK, Japan and Germany all posting solid readings and positive three-month momentum. The United States, by contrast, is positioned to the left of the vertical axis, signalling a modest loss of recent momentum even though the level of activity remains comfortably above the 50 threshold. At the top end, India continues to stand out with both strong levels and firm recent gains, underlining the resilience of its domestic demand cycle. Meanwhile, France sits close to the stagnation line, highlighting ongoing softness within parts of the euro area. For markets, the key takeaway is that global growth has not rolled over — but leadership is broadening and becoming more differentiated across regions.
Chart 1: Flash PMIs in February – 3-month changes versus levels
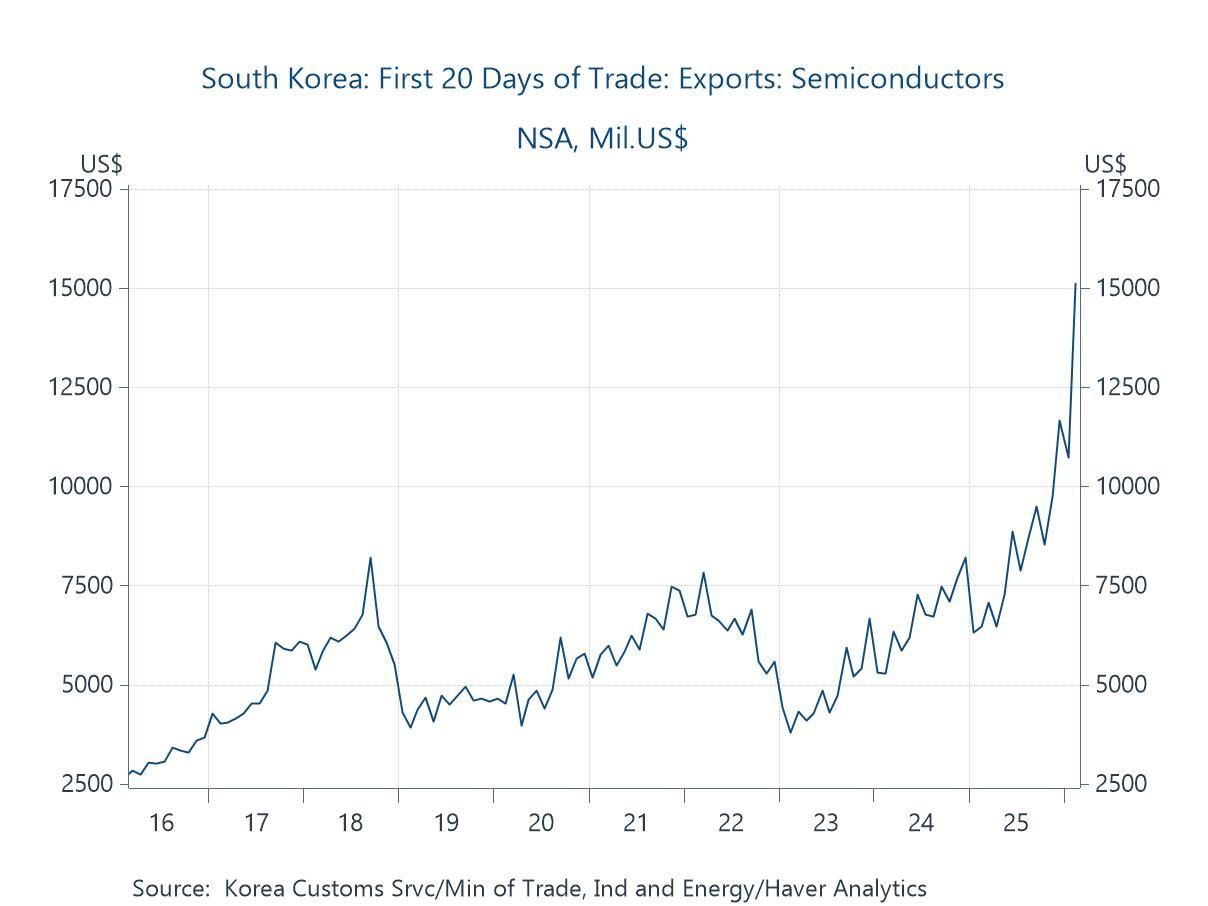
South Korea’s Semiconductor Trade One factor helping to sustain global activity may well be the ongoing AI investment cycle, and Korea’s semiconductor exports provide a timely illustration. As the chart shows, shipments in the first 20 days of February have surged to fresh highs, extending the powerful upswing seen over the past year. Given Korea’s central role in the global memory and advanced chip supply chain, this strength is unlikely to be purely cyclical. Instead, it is consistent with continued heavy demand linked to data centres, high-performance computing and broader AI infrastructure build-out. In that sense, while parts of the global economy show signs of cooling, the AI capex cycle appears to be providing an important offset — reinforcing trade flows and helping to keep overall activity on a firmer footing than might otherwise have been expected.
Chart 2: South Korea’s Semiconductor Exports
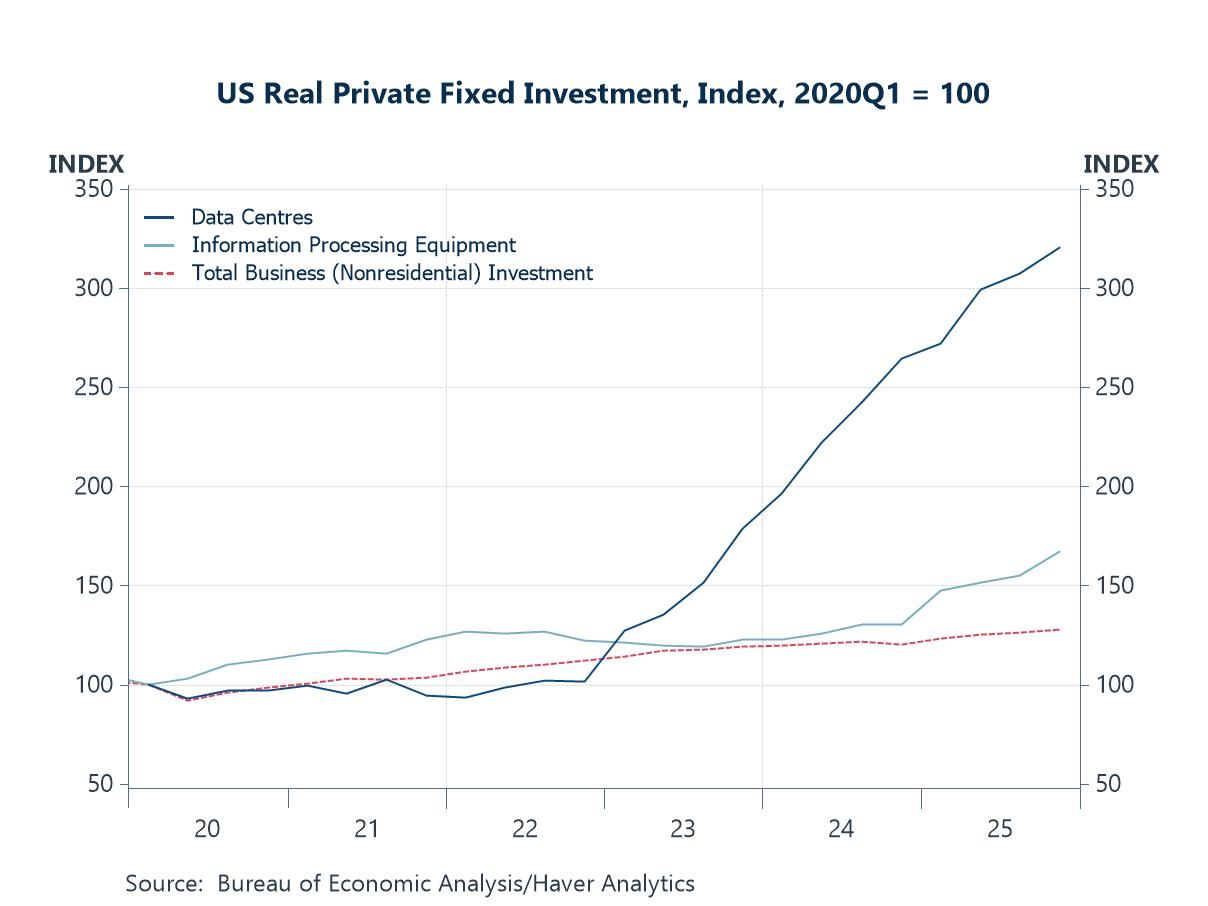
US Investment in Data Centres The surge in Korea’s semiconductor exports is echoed in the composition of US investment, where AI-related capital spending continues to accelerate. As the chart shows, real private fixed investment in data centres has risen sharply since 2022, significantly outpacing both information processing equipment and overall non-residential business investment. This divergence points to an ongoing, capital-intensive build-out of digital and cloud infrastructure, consistent with strong global demand for computing power. For markets, the key takeaway is that the AI investment cycle remains firmly in expansion mode, helping to underpin activity in both the US and the broader technology supply chain.
Chart 3: US Business Investment: Data centres and ICT equipment versus the total
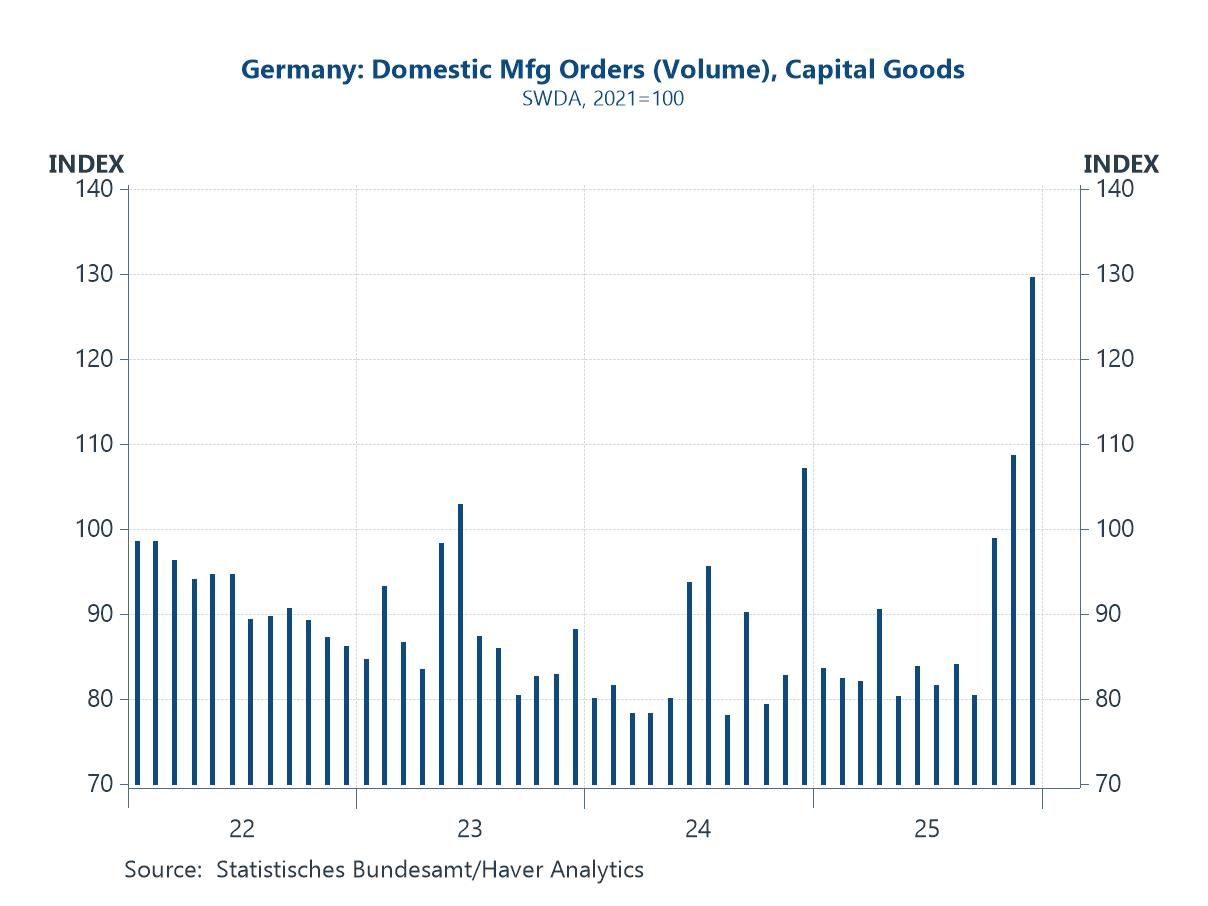
Germany’s Capex Cycle If the US investment story is being powered by AI infrastructure, the latest data suggest Germany may finally be seeing a cyclical turn of its own. As the chart shows, domestic capital goods orders have picked up noticeably in recent months after an extended period of weakness. While the series remains volatile, the recent spikes hint at a tentative revival in investment demand within Europe’s largest manufacturing economy. Part of this improvement may reflect the early effects of easier financial conditions, but there are also signs that increased defence spending and related industrial orders could be beginning to filter through the pipeline. More broadly, the contrast with the US is instructive: whereas America’s capex surge is heavily concentrated in digital and AI infrastructure, Germany’s rebound appears more traditional and policy-driven, potentially marking the early stages of a broader European investment stabilisation.
Chart 4: Germany’s Domestic Capital Goods Orders
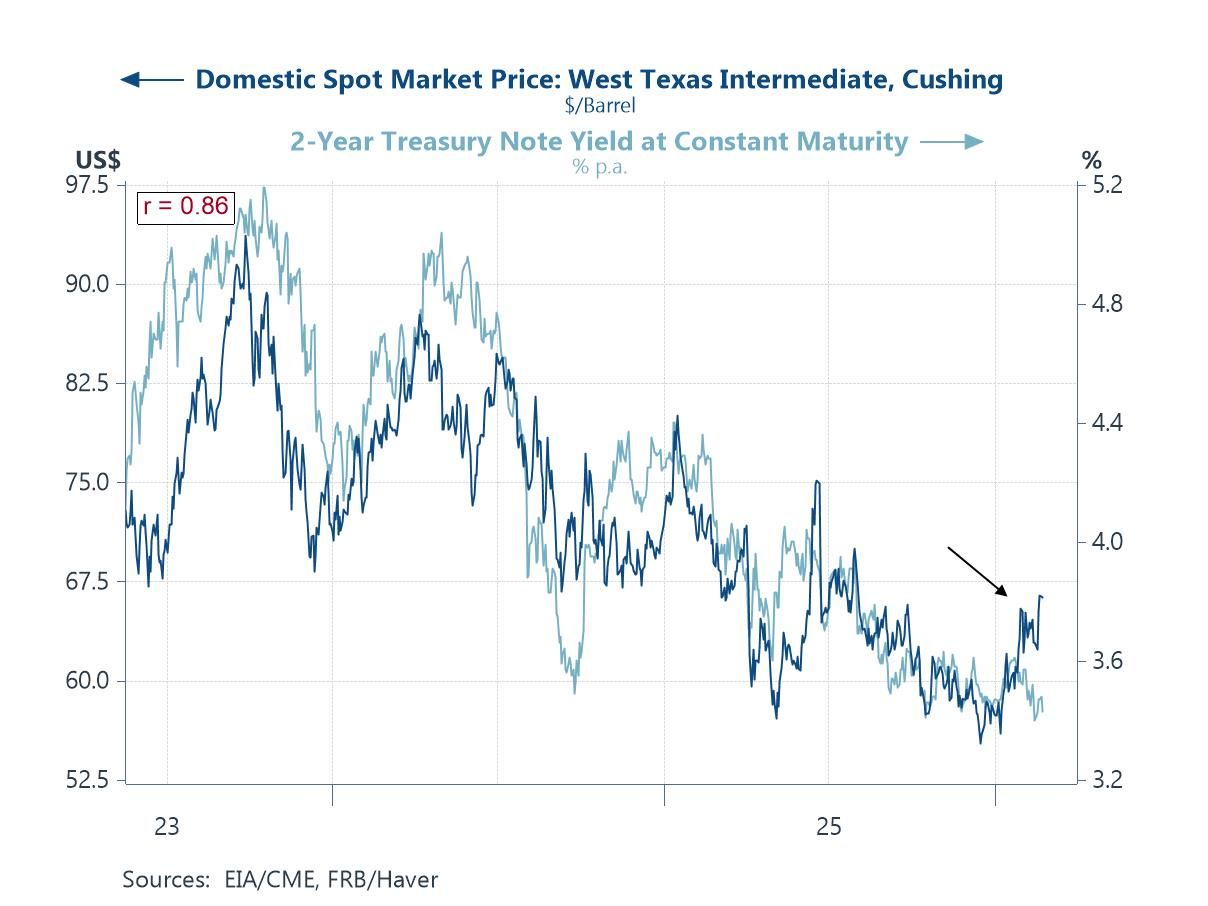
Oil Prices, Policy and Financial Markets Shifting focus from investment to markets, the close co-movement between oil prices and short-term Treasury yields remains striking. As the chart highlights, the correlation between WTI and the US 2-year yield has stayed unusually tight, underscoring how energy markets continue to feed directly into macro and policy expectations. Recent weeks have also seen a modest firming in crude, in part reflecting renewed geopolitical tensions involving Iran and the associated risk premium around Middle East supply routes. Oil has hovered near multi-month highs amid rising military and diplomatic strains between Washington and Tehran, even though physical supply has not yet been disrupted. For investors, the key point is that energy-driven inflation risks have not fully faded, meaning oil price volatility could still complicate the timing and extent of policy easing globally.
Chart 5: Global Oil Prices Versus US 2-year Treasury Yield
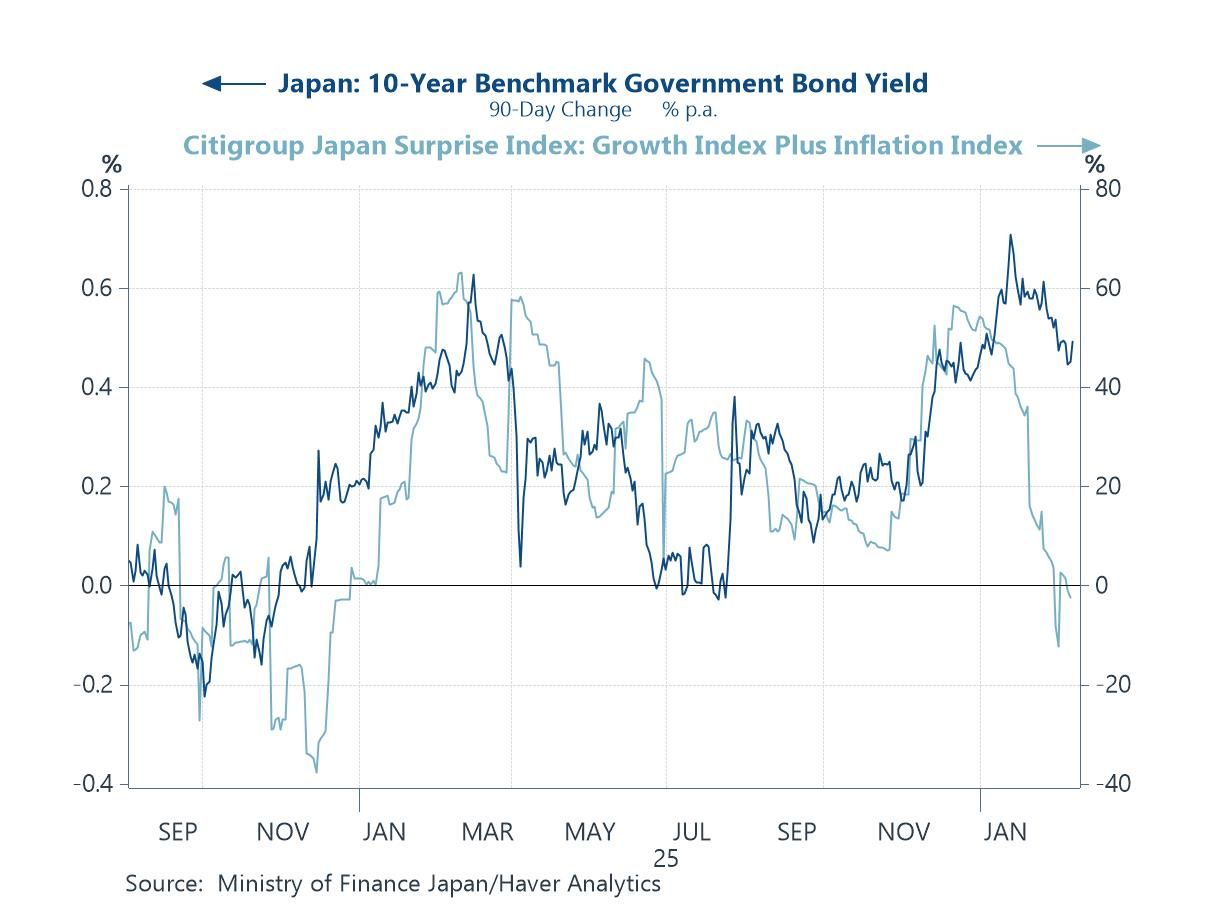
Japan’s 10-year JGB yields and data surprises Finally, developments in Japan’s bond market are also worth watching from a global perspective. The chart shows a clear relationship between the three-month change in 10-year JGB yields and the Citi Japan surprise indices, with yields tending to track shifts in the growth and inflation data flow. In recent weeks, the downward drift in JGB yields has been particularly notable. The move appears consistent with a run of softer-than-expected growth and inflation readings, which have tempered near-term tightening expectations. Given Japan’s outsized role in global capital markets and carry dynamics, even modest moves in JGB yields can have broader spillovers. To that extent, the recent pullback may have provided a mild anchoring influence on global bond markets at the margin, even as the broader normalization narrative remains intact.
Chart 6: Japan’s 10-year JGB yields versus domestic growth and inflation surprises

Andrew Cates
AuthorMore in Author Profile »Andy Cates joined Haver Analytics as a Senior Economist in 2020. Andy has more than 25 years of experience forecasting the global economic outlook and in assessing the implications for policy settings and financial markets. He has held various senior positions in London in a number of Investment Banks including as Head of Developed Markets Economics at Nomura and as Chief Eurozone Economist at RBS. These followed a spell of 21 years as Senior International Economist at UBS, 5 of which were spent in Singapore. Prior to his time in financial services Andy was a UK economist at HM Treasury in London holding positions in the domestic forecasting and macroeconomic modelling units. He has a BA in Economics from the University of York and an MSc in Economics and Econometrics from the University of Southampton.
More Economy in Brief


