 Global| May 07 2026
Charts of the Week: Still Standing
by:Andrew Cates
|in:Economy in Brief
Summary
Recent developments point to the possibility of a peace settlement in the Middle East, which has offered some tentative relief to energy markets. Financial markets have responded with cautious optimism, but the outlook remains highly uncertain, with much depending on whether any agreement proves durable and supply disruptions are fully unwound. Against this backdrop, our charts this week highlight a global economy that is holding up better than expected but facing renewed cost pressures. Manufacturing activity remains resilient, supported by AI investment, reduced tariff disruption and defence spending, even as output prices firm (chart 1). Supply-side frictions are also still evident: shipping costs have risen, broader supply chain pressures are rebuilding (chart 2), and crude oil production has been curtailed by export and storage constraints among key regional producers (chart 3). These dynamics have reinforced inflation risks and shifted policy expectations in a more hawkish direction (chart 4). Meanwhile, US credit conditions appear broadly neutral, suggesting neither strong deleveraging nor releveraging pressures (chart 5). Finally, wage growth remains central to the outlook, particularly in the UK, where pressures are still comparatively elevated (chart 6). Taken together, the message is one of resilience under strain: growth is holding up, but the balance between inflation and activity is becoming increasingly delicate, leaving policymakers—and markets—navigating a narrow and uncertain path ahead.
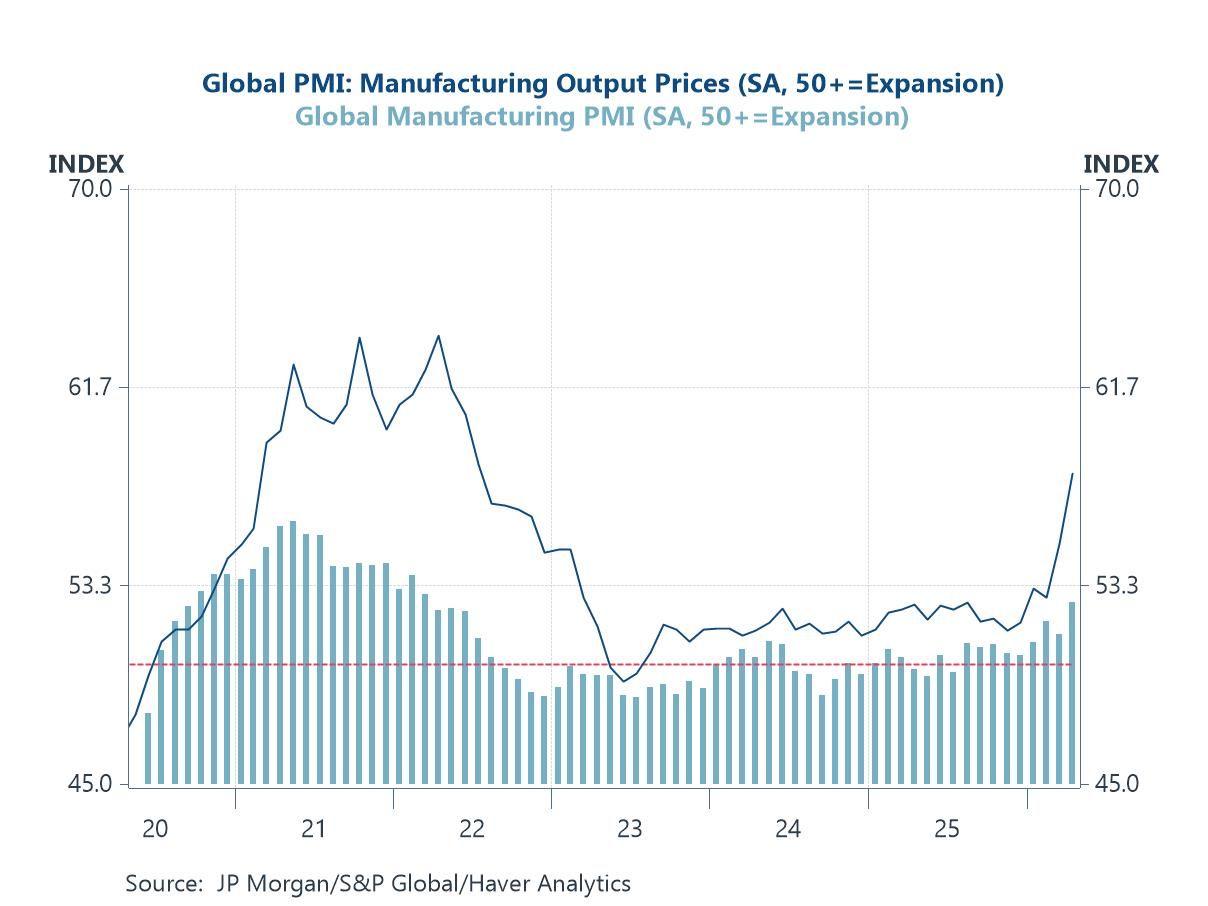
Resilient Output, Rising Prices Against the backdrop of ongoing tensions in the Middle East and the associated rise in energy prices, global manufacturing activity has shown a notable degree of resilience. The latest PMI data suggest that output continues to expand at a steady pace, defying what might typically be expected in the face of a renewed energy shock. Several factors appear to be underpinning this resilience, including continued momentum in AI-related investment, a partial easing of earlier US tariff-related disruptions, and a sustained ramp-up in defence-related production. At the same time, however, the chart highlights a clear firming in output prices, pointing to a re-emergence of cost pressures within the global manufacturing sector. This combination—resilient activity alongside rising price pressures—reinforces the view that the current shock is feeding more into inflation dynamics than into an outright contraction in global output, at least for now.
Chart 1: Global Manufacturing Holds Up as Output Prices Re-Accelerate
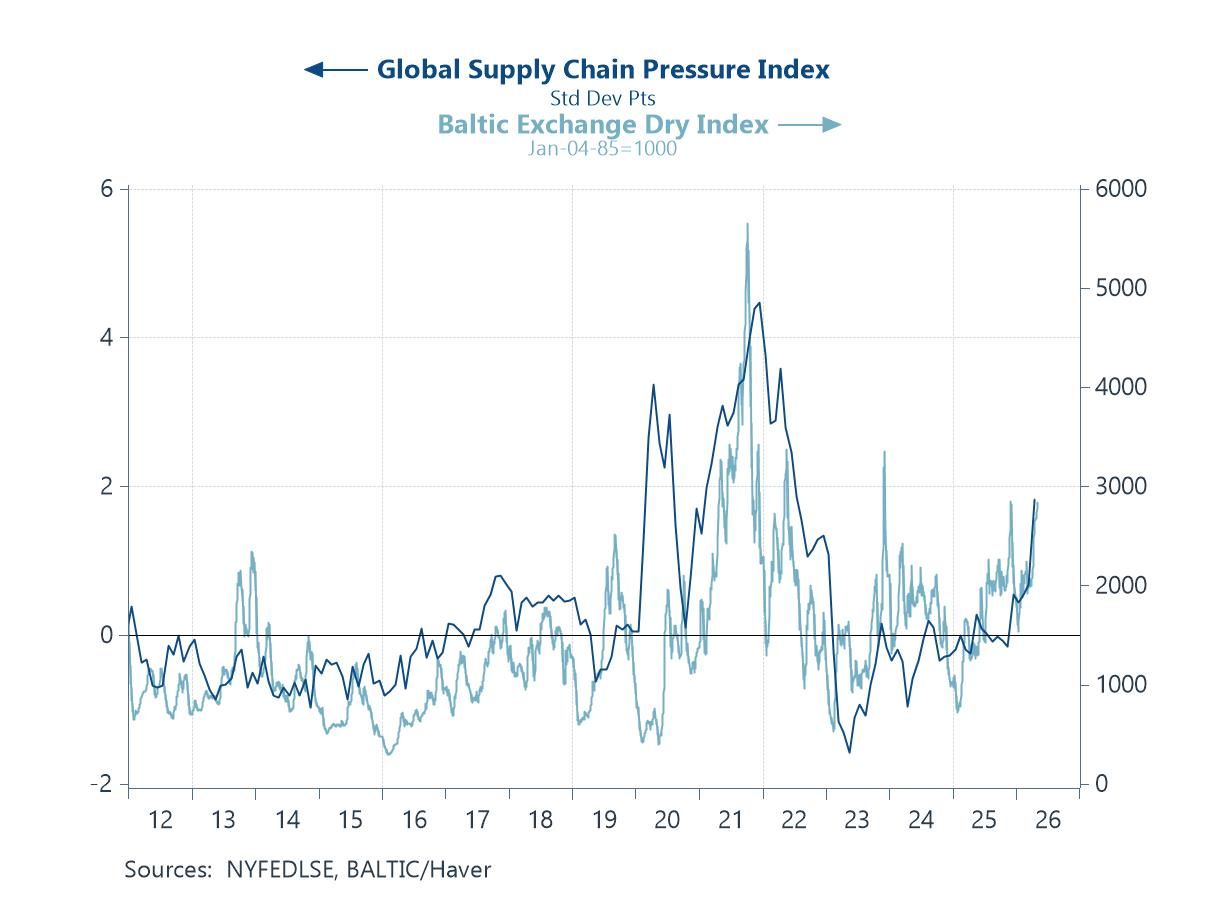
Supply Chains Stir Again If the resilience of global manufacturing suggests that activity is holding up, this next chart highlights where the strain is re-emerging—on the supply side. Both the Baltic Dry Index and broader measures of global supply chain pressure have begun to move higher again, pointing to a renewed tightening in shipping capacity and logistics conditions. While nowhere near the extremes seen during the pandemic, the recent upturn is notable in the context of heightened geopolitical risk, particularly given the vulnerability of key shipping routes through the Middle East. Disruptions to energy flows and maritime traffic, alongside rising insurance and freight costs, are feeding through into global trade costs more broadly.
Chart 2: Shipping Costs and Supply Pressures Rebuild
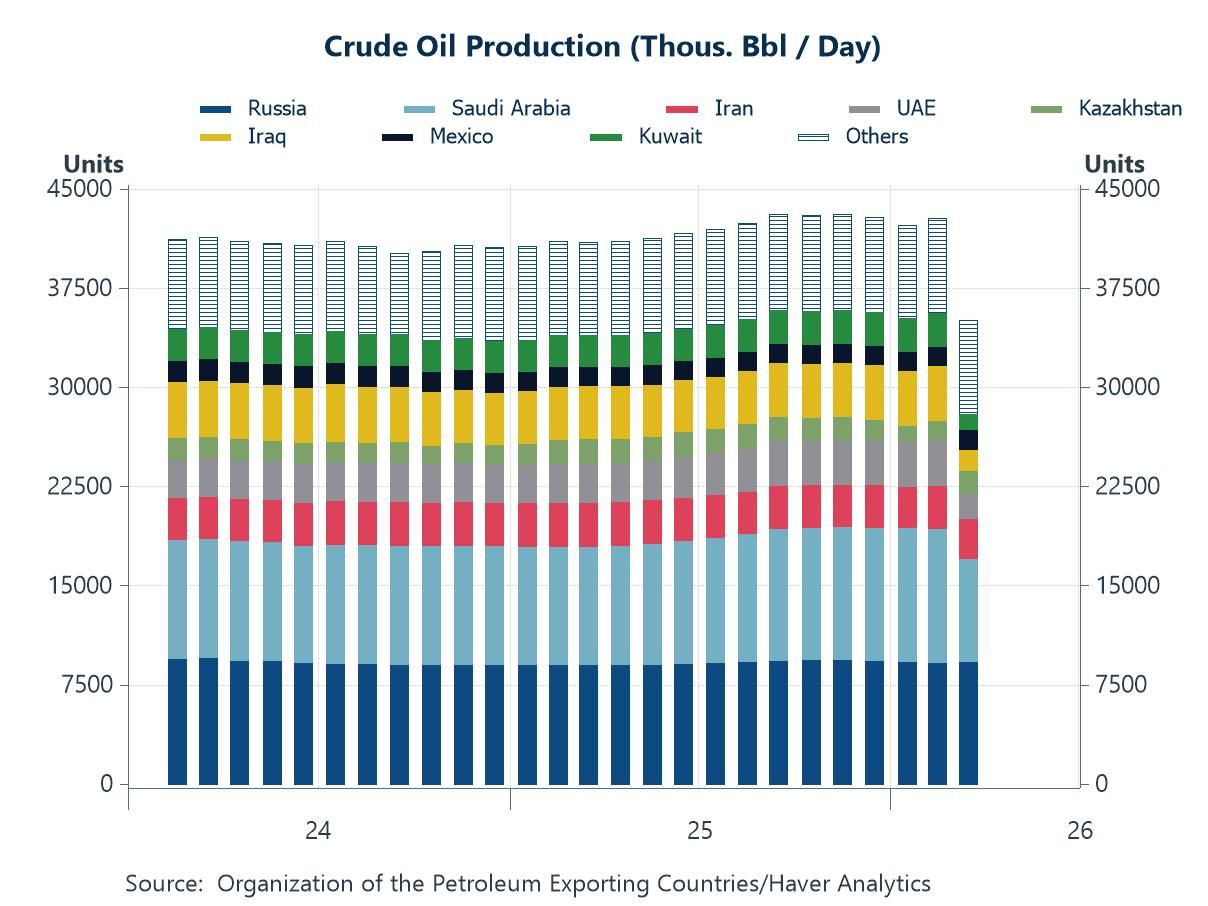
Oil Production Constraints If the previous chart highlights rising supply chain frictions, this one shows how those pressures are now feeding directly into production decisions. Crude oil output among key producers has begun to adjust in response to disruptions around the Strait of Hormuz, with countries such as Saudi Arabia, Iran and the UAE facing growing constraints on their ability to export. With shipping routes impaired, production has increasingly been diverted into storage—but this is not a limitless buffer. As storage capacity tightens, producers are effectively forced to scale back output, not because of weak demand, but due to logistical bottlenecks. This dynamic helps explain the recent softness in aggregate production levels and underscores the supply-driven nature of the current energy shock. Looking ahead, even a reopening of key routes may not immediately normalize flows. Elevated inventories, constrained tanker capacity, and evolving OPEC dynamics—not least the UAE’s departure—suggest that supply adjustment could remain uneven, prolonging upward pressure on energy prices and, by extension, global inflation.
Chart 3: Oil Output Adjusts as Export Constraints Bite
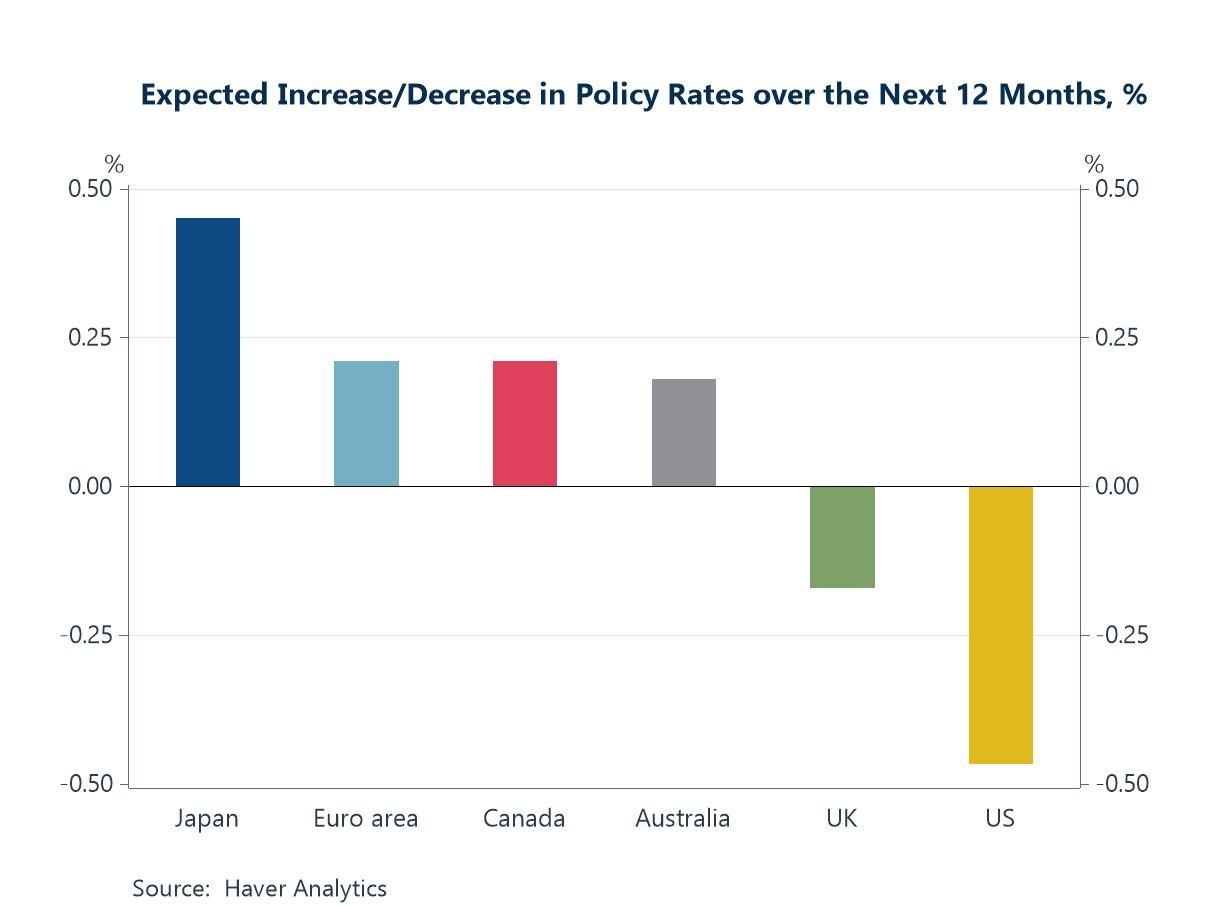
A More Hawkish Bias If supply-side pressures are beginning to reassert themselves, the implications for monetary policy are becoming increasingly evident. The latest Blue Chip Financial Forecasts survey points to a growing consensus that policy rates are more likely to move higher over the next twelve months across most major economies, with expectations for further tightening particularly evident in Japan, the euro area, Canada and Australia. This reflects a broader reassessment of the inflation outlook, as persistent energy-related pressures raise the risk of more durable price dynamics. That said, the picture is more nuanced in the US and the UK, where the consensus view still leans toward modest easing over the coming year. However, market pricing and broader sentiment appear to be shifting more quickly, with an increasing number of participants questioning whether rate cuts will materialise at all. Indeed, in both the US and the UK, there is a growing sense that further tightening could yet be required if energy-driven inflation proves more persistent, underscoring the increasingly uncertain and finely balanced policy environment facing central banks.
Chart 4: Policy Expectations Shift as Tightening Risks Rebuild
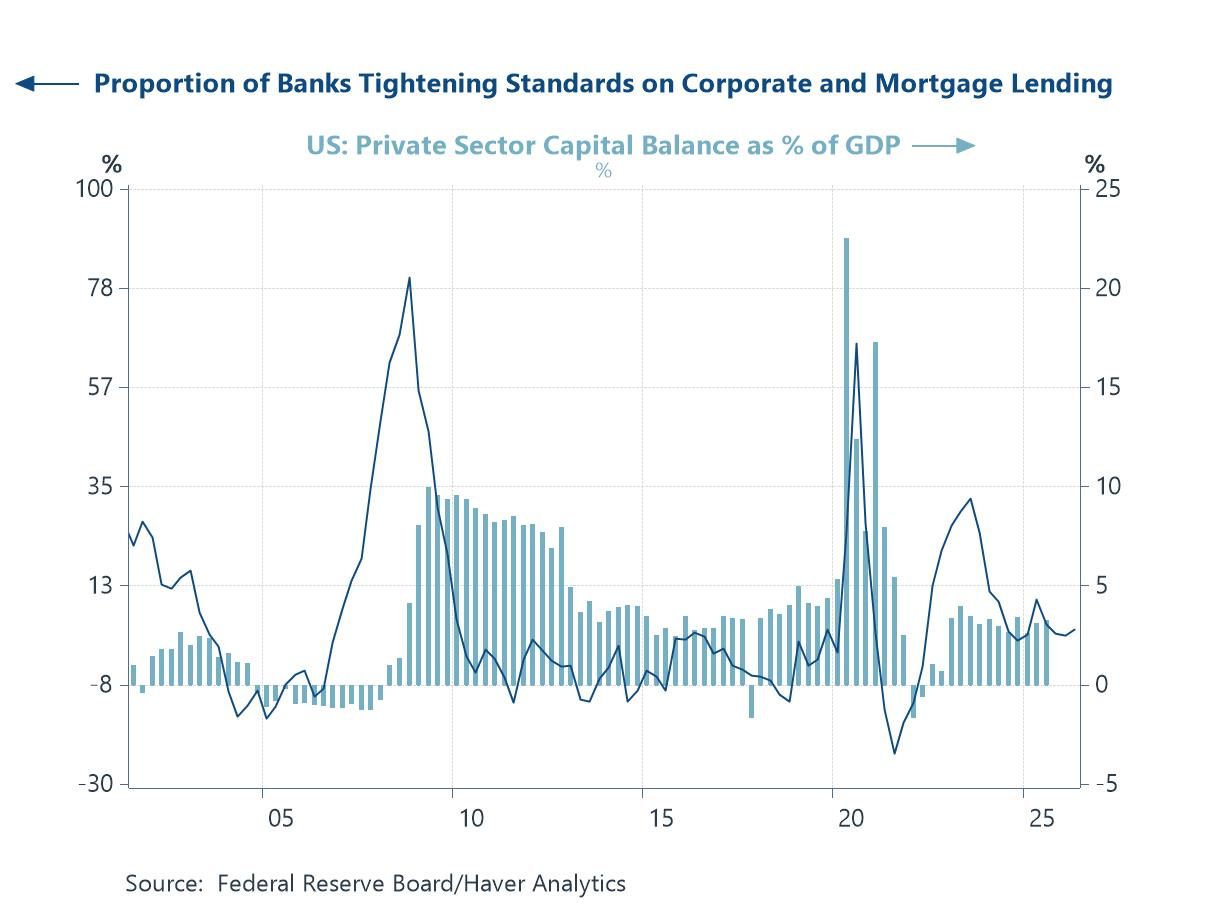
US Credit Conditions: Neither Tight Nor Loose If the policy outlook is becoming more finely balanced, credit conditions appear to be reflecting a similar sense of equilibrium. The latest US Senior Loan Officer Opinion Survey (SLOOS) suggests that, in aggregate, bank lending standards are no longer tightening meaningfully but nor are they easing materially either. This is consistent with the chart, where the share of banks tightening standards has moved closer to neutral territory following earlier periods of more pronounced tightening. As a result, the broader credit backdrop does not currently point to strong deleveraging pressures, nor does it suggest a renewed wave of credit expansion. Instead, the private sector appears to be in a holding pattern, with balance sheets broadly stable and credit conditions neither acting as a significant headwind nor a meaningful tailwind to growth.
Chart 5: US Bank Lending Standards and Demand versus the Private Sector Savings Balance
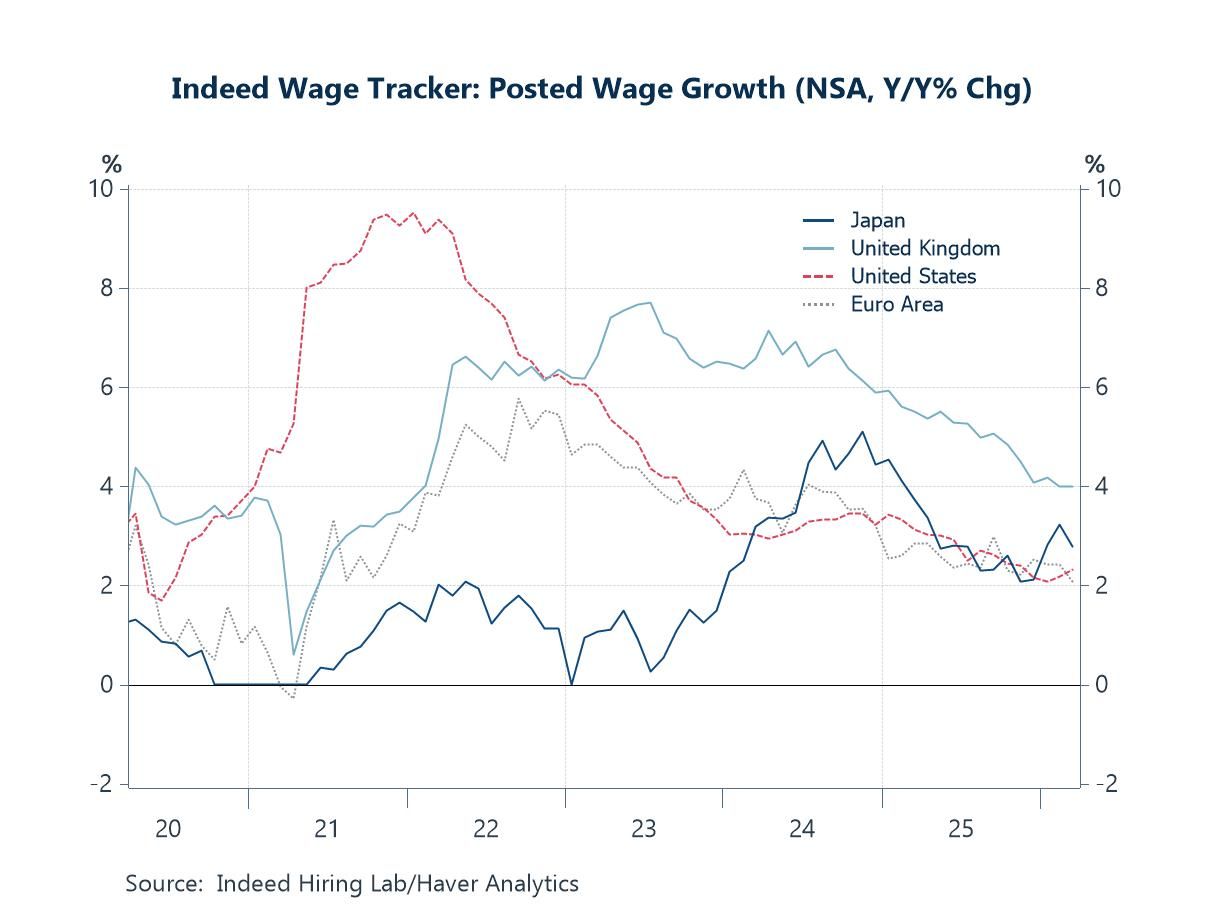
Labouring the point If supply-side pressures and policy uncertainty are shaping the near-term outlook, labour market dynamics—and in particular wage growth—remain central to how this ultimately feeds through into inflation. The latest Indeed wage tracker suggests that while wage pressures have eased from their peaks across most major economies, they remain elevated relative to pre-pandemic norms. This is especially evident in the UK, where posted wage growth continues to run at comparatively high levels, underscoring persistent domestic cost pressures. More broadly, the stickiness of wage growth helps explain why central banks remain cautious in declaring victory over inflation. Even as energy-driven price pressures fluctuate, the risk is that tight labour markets and firm wage dynamics sustain underlying inflation at levels above target. In that sense, labour market conditions remain a critical transmission channel—determining whether the current supply shock proves temporary or evolves into a more persistent inflationary regime.
Chart 6: Wage Pressures Ease—but Remain Elevated in Key Economies

Andrew Cates
AuthorMore in Author Profile »Andy Cates joined Haver Analytics as a Senior Economist in 2020. Andy has more than 25 years of experience forecasting the global economic outlook and in assessing the implications for policy settings and financial markets. He has held various senior positions in London in a number of Investment Banks including as Head of Developed Markets Economics at Nomura and as Chief Eurozone Economist at RBS. These followed a spell of 21 years as Senior International Economist at UBS, 5 of which were spent in Singapore. Prior to his time in financial services Andy was a UK economist at HM Treasury in London holding positions in the domestic forecasting and macroeconomic modelling units. He has a BA in Economics from the University of York and an MSc in Economics and Econometrics from the University of Southampton.


