 Global| Sep 30 2022
Charts of the Week (Sep 30, 2022)
by:Andrew Cates
|in:Economy in Brief
Summary
Financial instability has risen meaningfully over the past few days as global equity markets have slumped to new lows for this year while US bond yields have spiked to new highs. As our first chart this week underscores, more hawkish rhetoric and policy activism from central banks – and the Fed in particular – have been key triggers for these moves. Another trigger, however, can be traced to the UK, where heightened concerns about debt sustainability and inflation have – as our second chart suggests – perhaps unsurprisingly soured demand for UK assets. Higher US interest rates appear to now be souring the outlook for the housing market too, as evidenced in our third chart this week. As for Europe, our fourth and fifth charts this week underscore how its dependence on Russian energy remains a key source of downside risk for the economy. Finally, Asia’s heavy dependence on world trade and lingering pandemic restrictions are additionally taking their toll on regional GDP growth, as evidenced in our final chart this week.
Financial market instability
As noted, more hawkish rhetoric from central banks – and the Fed in particular - and policy-induced instability in the UK have unsettled financial markets this week. Longer-term real rates in the US (and elsewhere) have increased sharply as a consequence and also driven equity prices down sharply. Interest rate expectations clearly remain critical though for investor sentiment, which is underscored by the high correlation between real rates and global equity prices in chart 1 below.
Chart 1: Equity markets have fallen to new lows for this year as US real rates climbed to new highs

UK turmoil
Although some intervention from the Bank of England this week has helped stabilize UK fixed income markets, the outlook for the UK remains troubling. Instigating an unfunded fiscal policy stimulus was always likely to be challenging, however, against the underlying backdrop for the economy that we illustrate in chart 2 below. This shows the UK’s sectoral financial balances – the difference between the income and spending – of the private non-financial, government and overseas sectors, with the latter measured by the current account. The latter was in deficit to the tune of 8.3% of GDP in Q2, a multi-decade high.
Since these balances must (with the addition of the financial sector) square up, an unfunded fiscal policy stimulus (which will likely drive the government sector into a bigger deficit position) raises financing difficulties if there isn’t compensation for e.g. overseas investors via a weaker exchange rate and higher interest rates. The latter could also however lift private sector savings posing risks for economic stability in the period ahead.
Chart 2: The UK’s financial imbalances have been a big source of recent financial stress

US housing woes
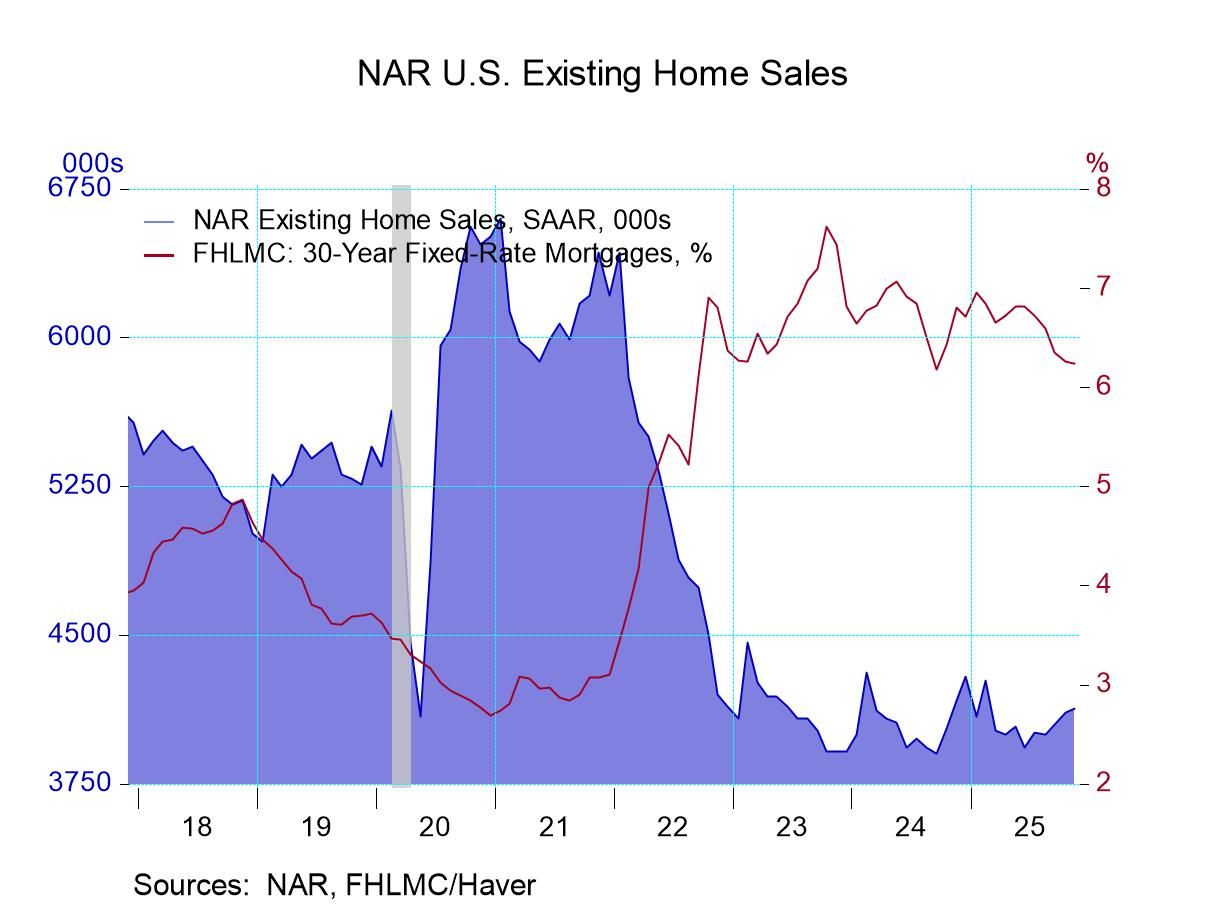
Returning to the US where higher US interest rates are increasingly weighing on the housing market. Incoming data this week for mortgage applications, house prices and pending home sales suggest the market is now cooling off (see chart 3).
Chart 3: Weakening mortgage refinancing activity points to softer US house price inflation

Weaker European confidence
This week’s survey data from Europe also point to some further weakening of economic growth. The EU Commission’s latest September survey, for example, revealed a broadly-based weakening of both business and consumer confidence across the Euro Area, the latter from levels that were already at multi-years lows. Much of this can be traced to high energy prices as price expectations, having ebbed in recent months, reversed course and rose again in September, echoing the trend in European natural gas prices in the previous few weeks.
Chart 4: Weaker economic sentiment in the EU but higher price expectations in September

Germany’s energy dependence
That sentiment in Germany – and consumer sentiment in particular – is relatively weak (compared with other European countries) is also a function of its heavy dependence on imported energy from Russia. However, high prices are seemingly diverting demand to other sources of supply, as evidenced in chart 5 below.
Chart 5: Shifting sources of natural gas imports in Germany

Recession warnings in Asia
A high sensitivity to world trade – and to trade in goods and to China in particular – combined with a vulnerability to tighter financial market conditions - is taking its toll on the Asian region’s growth performance. That COVID restrictions have been quite tight in many countries – and China in particular – has not helped matters. The upshot is that our aggregation of the region’s GDP contracted by 1.2% in Q2 (see chart 6 below).
Chart 6: A contraction in Asia’s regional GDP in Q2 carries recession warnings

Andrew Cates
AuthorMore in Author Profile »Andy Cates joined Haver Analytics as a Senior Economist in 2020. Andy has more than 25 years of experience forecasting the global economic outlook and in assessing the implications for policy settings and financial markets. He has held various senior positions in London in a number of Investment Banks including as Head of Developed Markets Economics at Nomura and as Chief Eurozone Economist at RBS. These followed a spell of 21 years as Senior International Economist at UBS, 5 of which were spent in Singapore. Prior to his time in financial services Andy was a UK economist at HM Treasury in London holding positions in the domestic forecasting and macroeconomic modelling units. He has a BA in Economics from the University of York and an MSc in Economics and Econometrics from the University of Southampton.


