Global| Mar 11 2026
Charts of the Week: Geopolitics Meets the Global Economy
by:Andrew Cates
|in:Economy in Brief
Summary
The past few days have seen financial markets rattled by a sharp escalation of tensions in the Middle East, with oil prices rising, risk assets wobbling and investors reassessing the potential macroeconomic fallout from a possible energy shock. Yet, taken together, this week’s charts suggest that the global economic outlook has so far remained relatively resilient. Blue Chip consensus forecasts for 2026 growth have held steady in recent months, with Taiwan’s steadily improving outlook hinting at the ongoing influence of the global AI investment cycle. That said, forward-looking sentiment indicators are beginning to show some cracks: the latest Sentix expectations index registered a sharp deterioration in March, potentially reflecting rising geopolitical uncertainty. Inflation expectations, by contrast, have shifted only modestly, with forecasters making few meaningful revisions despite the recent surge in oil prices. Financial markets appear to share that view, as movements in two-year US Treasury yields—often a proxy for expectations of Federal Reserve policy—have not mirrored the sharp rise in crude prices, suggesting investors currently see the oil shock as temporary. The final charts highlight why energy markets nonetheless remain central to the outlook: many major economies remain significant net oil importers, and in much of Asia oil price movements feed quickly into consumer energy inflation. Should geopolitical tensions persist and keep crude prices elevated, these channels could yet transmit broader macroeconomic pressures in the months ahead.
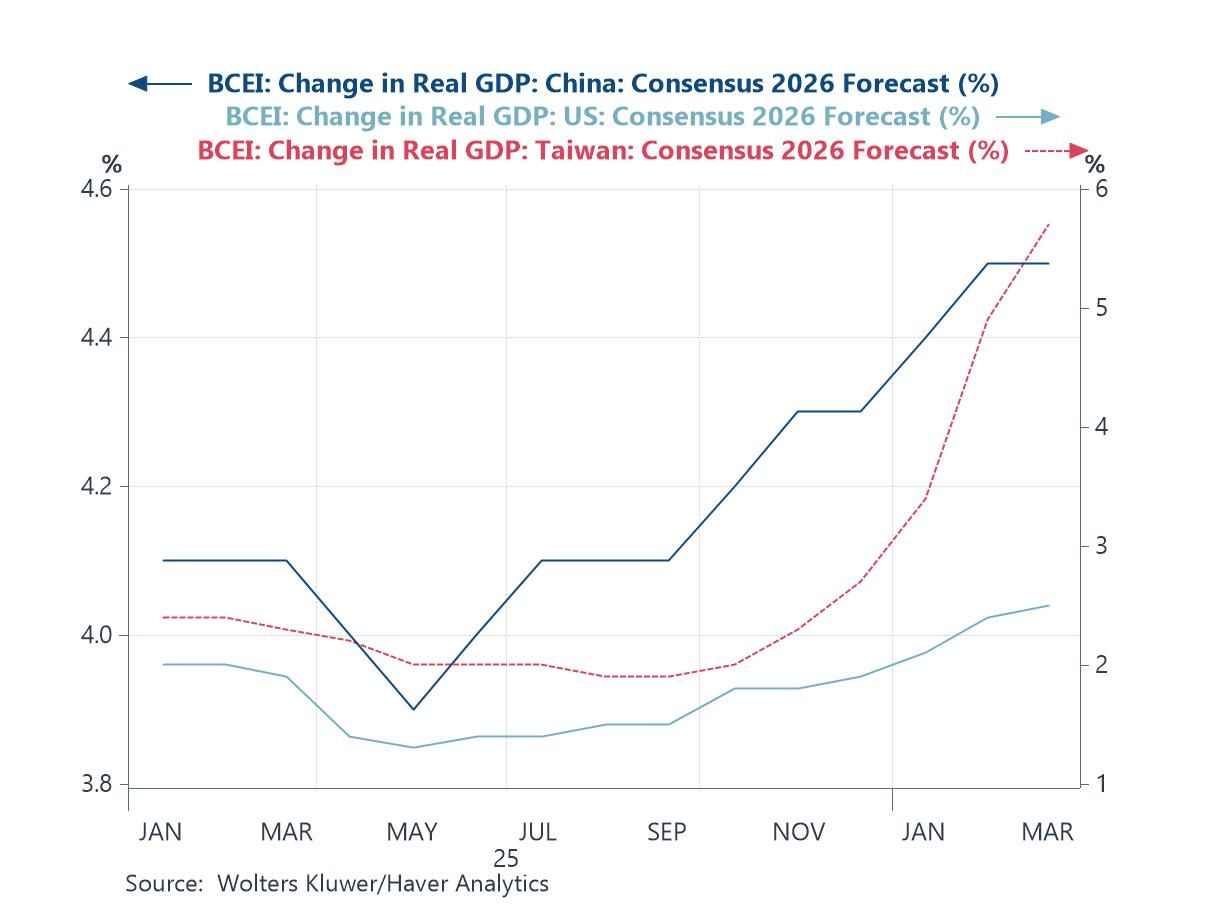
The Blue Chip Growth Consensus The first chart this week tracks the evolution of Blue Chip consensus forecasts for 2026 real GDP growth over the past six months for the United States, China and Taiwan. What stands out is the remarkable stability—and in some cases gradual improvement—in growth expectations, even as the geopolitical backdrop has become more unsettled. A backdrop of intense geopolitical instability in the Middle East historically tends to introduce downside risks to global activity through higher energy prices, shipping disruptions and financial market volatility. Yet the consensus outlook for the world economy has so far remained broadly resilient. One reason may lie in the continuing strength of investment tied to artificial intelligence. Taiwan’s growth outlook has been revised steadily higher in recent months, reflecting its pivotal role in the global semiconductor ecosystem and the infrastructure build-out associated with the AI boom. In that sense, the chart captures an interesting juxtaposition in the current global economy: rising geopolitical uncertainty on the one hand, and a powerful technology-driven investment cycle on the other.
Chart 1: Blue Chip: The evolution of the 2026 growth consensus for the US, China and Taiwan
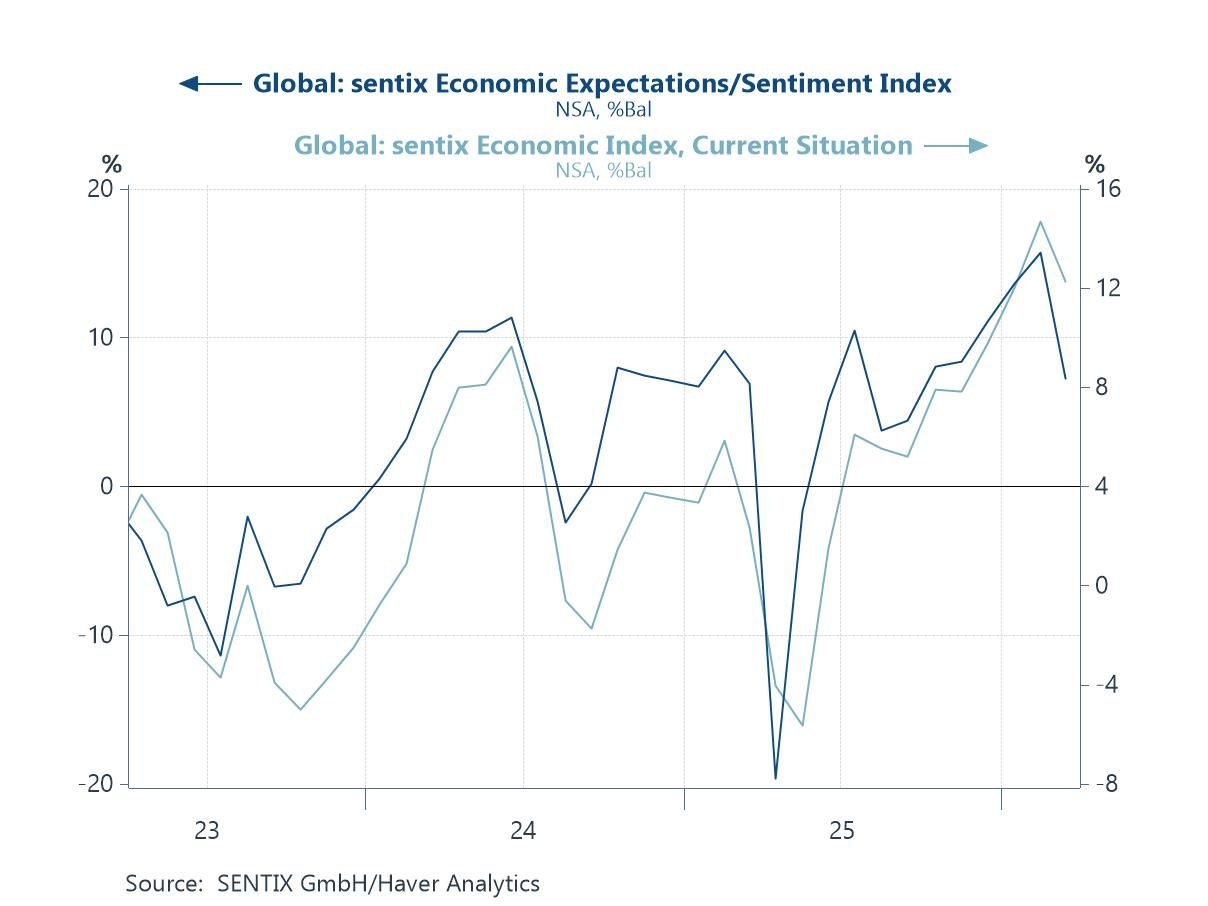
Sentiment surveys The picture becomes somewhat less reassuring when we turn to global sentiment indicators. The latest Sentix global economic expectations index shows a sharp deterioration in March, interrupting what had been a gradual improvement in global economic sentiment over the past year. Notably, the survey period coincided with the early stages of the recent escalation in tensions in the Middle East, suggesting that rising geopolitical risks may already be weighing on investor and analyst expectations. While the current conditions index remains relatively firm—consistent with the still-resilient growth outlook seen in the Blue Chip forecasts—the sudden downward lurch in expectations is potentially more concerning. Historically, sharp declines in forward-looking sentiment indicators such as this have sometimes served as early warning signals of a softening global growth environment, particularly when they coincide with rising energy prices and heightened geopolitical uncertainty.
Chart 2: Global sentix sentiment surveys lurched lower in March
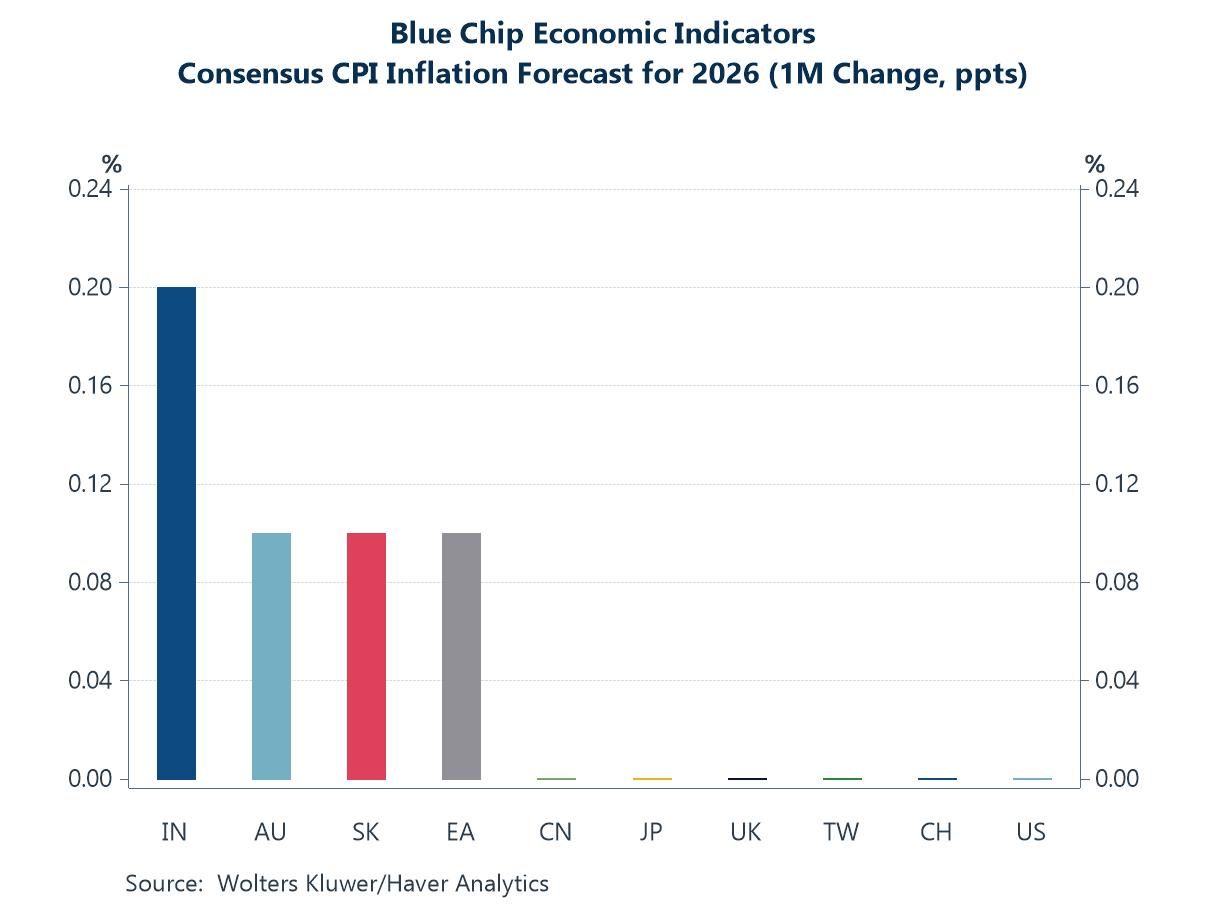
The Blue Chip Inflation Consensus Turning to inflation, the latest Blue Chip revisions suggest that forecasters have so far made only very modest adjustments to their outlook for 2026 consumer prices. As the chart shows, the largest upward revision this month was for India, while smaller increases were recorded for Australia, the euro area and South Korea. Elsewhere, forecasts were largely unchanged. What is notable is the absence of more widespread upward revisions, particularly given the sharp climb in oil prices in recent days following the escalation of tensions in the Middle East. For now, panelists appear to be assuming that the energy shock will prove either temporary or limited in scope. However, should higher oil prices persist—or begin to filter through more broadly into transportation and production costs—this relative stability in inflation forecasts could come under greater pressure in the months ahead.
Chart 3: Blue Chip: 1-month change in consensus 2026 inflation forecasts
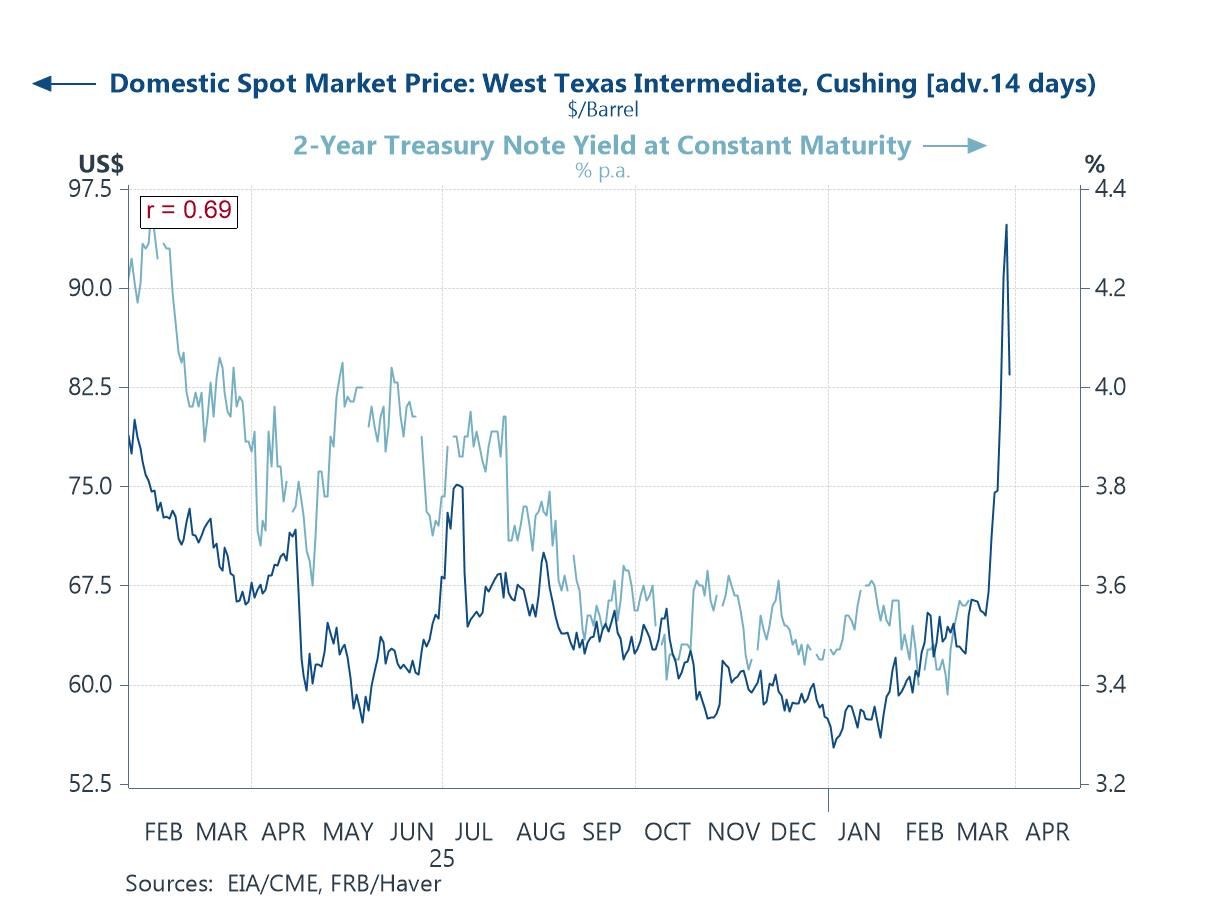
Oil prices and short-dated yields The next chart highlights the close relationship that often emerges between energy prices and expectations for U.S. monetary policy. Over the past year, movements in the price of West Texas Intermediate crude have tended to be mirrored—albeit imperfectly—in shifts in the yield on two-year US Treasury notes, a market-based proxy for expectations about the Federal Reserve’s policy path. The correlation between the two series has been relatively strong, reflecting the fact that oil price swings can influence inflation expectations and therefore the outlook for interest rates. Yet despite the recent sharp rise in oil prices associated with the escalation of tensions in the Middle East, there has so far been no comparable move higher in two-year Treasury yields. This relative stability suggests that financial markets may be assuming that the latest oil shock will prove temporary or, at least, insufficient to materially alter the Federal Reserve’s policy trajectory.
Chart 4: Shorted dated US yields often track oil price gyrations
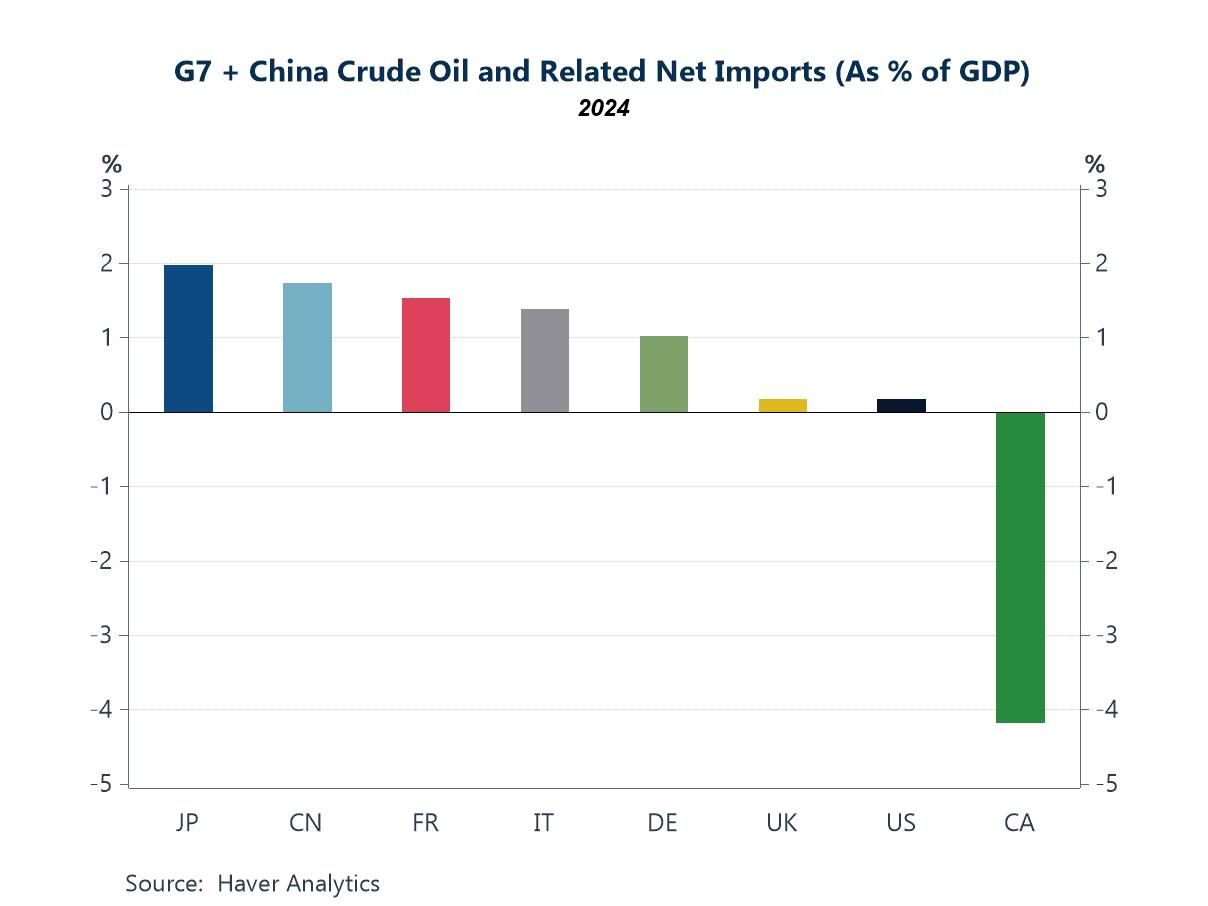
Oil exposure Staying with the theme of Middle East instability, the next chart highlights the varying degree to which major economies remain exposed to fluctuations in global oil markets. Measured as a share of GDP, Japan, China and several major European economies remain significant net importers of crude oil, leaving them more vulnerable to sustained increases in energy prices. Germany, France and Italy all retain notable import dependencies, while the United Kingdom’s exposure is comparatively modest. By contrast, the United States is now close to balance in crude trade, reflecting the transformation brought about by the shale revolution, while Canada stands out as a substantial net exporter. These differences matter in the current environment. Should geopolitical tensions lead to a sustained rise in oil prices, the macroeconomic burden would likely fall most heavily on the large importing economies, particularly in Asia and parts of Europe, where higher energy costs could weigh on growth and complicate the inflation outlook.
Chart 5: The import exposure of major economies to oil price shocks
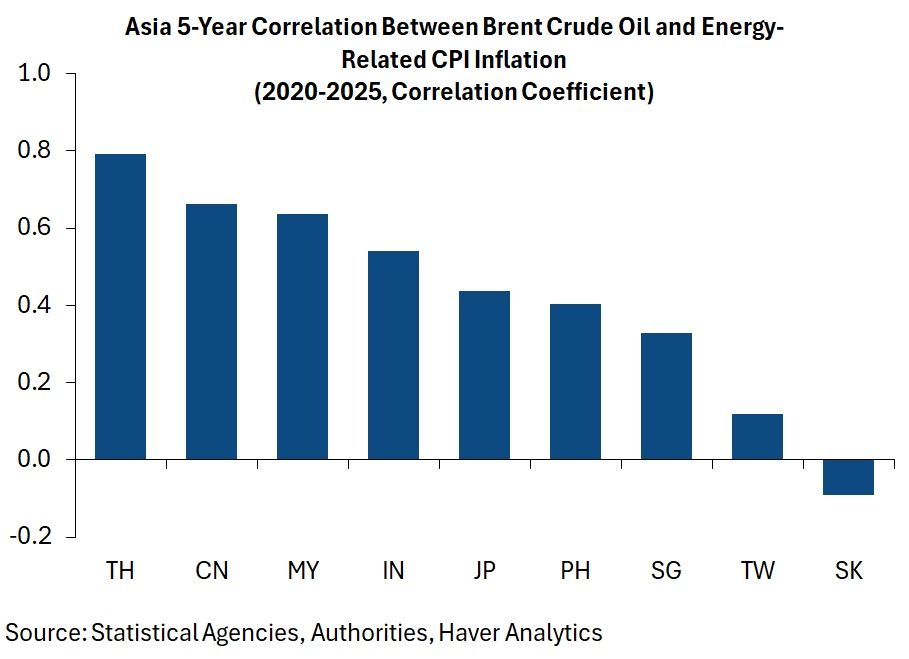
Oil prices and inflation The final chart stays with the theme of Middle East instability by highlighting the extent to which oil price movements tend to feed through into inflation dynamics across Asia. The five-year correlations between Brent crude prices and energy-related CPI inflation are positive and, in several cases, quite strong. Thailand, China and Malaysia show particularly high sensitivities, suggesting that swings in global oil prices are quickly reflected in domestic energy costs. India and Japan also display meaningful correlations, while the relationship is somewhat weaker in Singapore and Taiwan and even slightly negative in South Korea over this period. The broader message is that oil shocks rarely remain confined to energy markets alone. In many Asian economies, they transmit relatively quickly into inflation, potentially complicating monetary policy decisions if geopolitical tensions were to drive a sustained rise in crude prices.
Chart 6: Cross-country correlations between oil prices and headline inflation in selected Asian economies

Andrew Cates
AuthorMore in Author Profile »Andy Cates joined Haver Analytics as a Senior Economist in 2020. Andy has more than 25 years of experience forecasting the global economic outlook and in assessing the implications for policy settings and financial markets. He has held various senior positions in London in a number of Investment Banks including as Head of Developed Markets Economics at Nomura and as Chief Eurozone Economist at RBS. These followed a spell of 21 years as Senior International Economist at UBS, 5 of which were spent in Singapore. Prior to his time in financial services Andy was a UK economist at HM Treasury in London holding positions in the domestic forecasting and macroeconomic modelling units. He has a BA in Economics from the University of York and an MSc in Economics and Econometrics from the University of Southampton.
More Economy in Brief