 Global| Feb 19 2026
Charts of the Week: AI, Policy Easing and a Shifting Risk Premium
by:Andrew Cates
|in:Economy in Brief
Summary
Recent weeks have seen renewed market swings — a softer US dollar, rotation within equities and shifting rate expectations — as investors reassess valuations, policy risks and the durability of US exceptionalism. Yet a consistent macro thread runs through our charts this week. Global equities continued to outperform the US, hinting at a modest rise in the US risk premium alongside AI-valuation concerns (chart 1). At the same time, firmer bank lending growth across major economies reflects looser monetary policy and arguably helps explain why risk assets remain broadly supported despite volatility (chart 2). On productivity, a US pickup is evident but likely reflects capital deepening from AI infrastructure rather than a decisive surge in total factor productivity (chart 3). Industrial production in advanced Asia reinforces where that build-out is concentrated — at the heart of the semiconductor supply chain (chart 4) — while strong US orders for computers and electronic products underline the intensity of domestic demand for high-tech and AI-related equipment (chart 5). Finally, renewed equity inflows into Emerging Asia show investors positioning around this AI-centric growth dynamic (chart 6). In short, easier policy and AI-driven investment are sustaining momentum — but the breadth and durability of the productivity dividend remain a key open question.
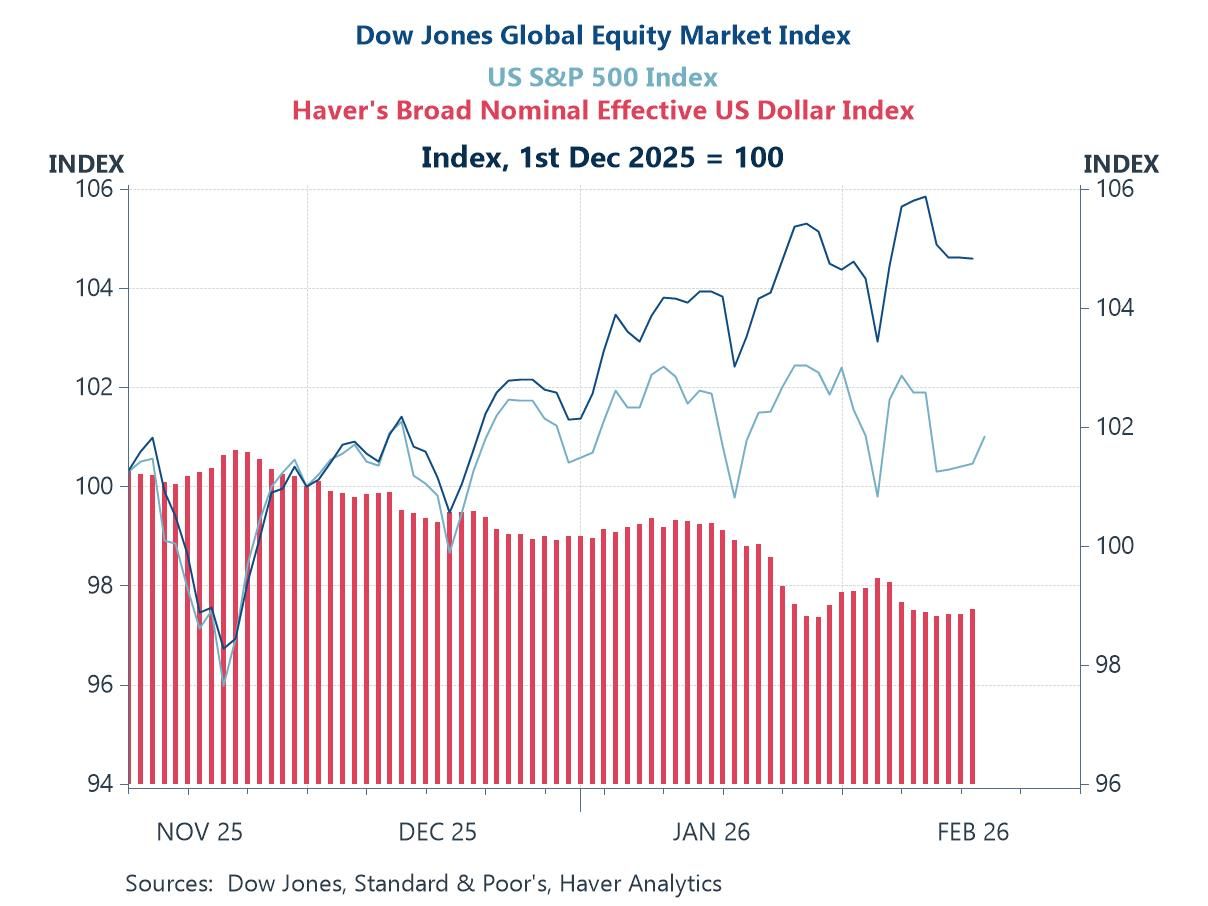
The US risk premium Over the past three months, global equities excluding the US have outperformed the S&P 500, while the broad US dollar index has edged lower — a subtle but potentially meaningful shift in market dynamics. After several years of US exceptionalism driven heavily by a narrow group of AI-exposed mega-cap stocks, investors appear increasingly sensitive to elevated US valuations, geopolitical noise and questions about how much of the AI upside is already priced in. The combination of relative US equity underperformance and a softer dollar suggests a modest rise in the US risk premium and a gradual rotation of capital toward the rest of the world. It is far from a wholesale reversal, but it does hint that the automatic bid for US assets may no longer be quite as unquestioned as it once was.
Chart 1: US versus ROW Equity Markets and the US dollar
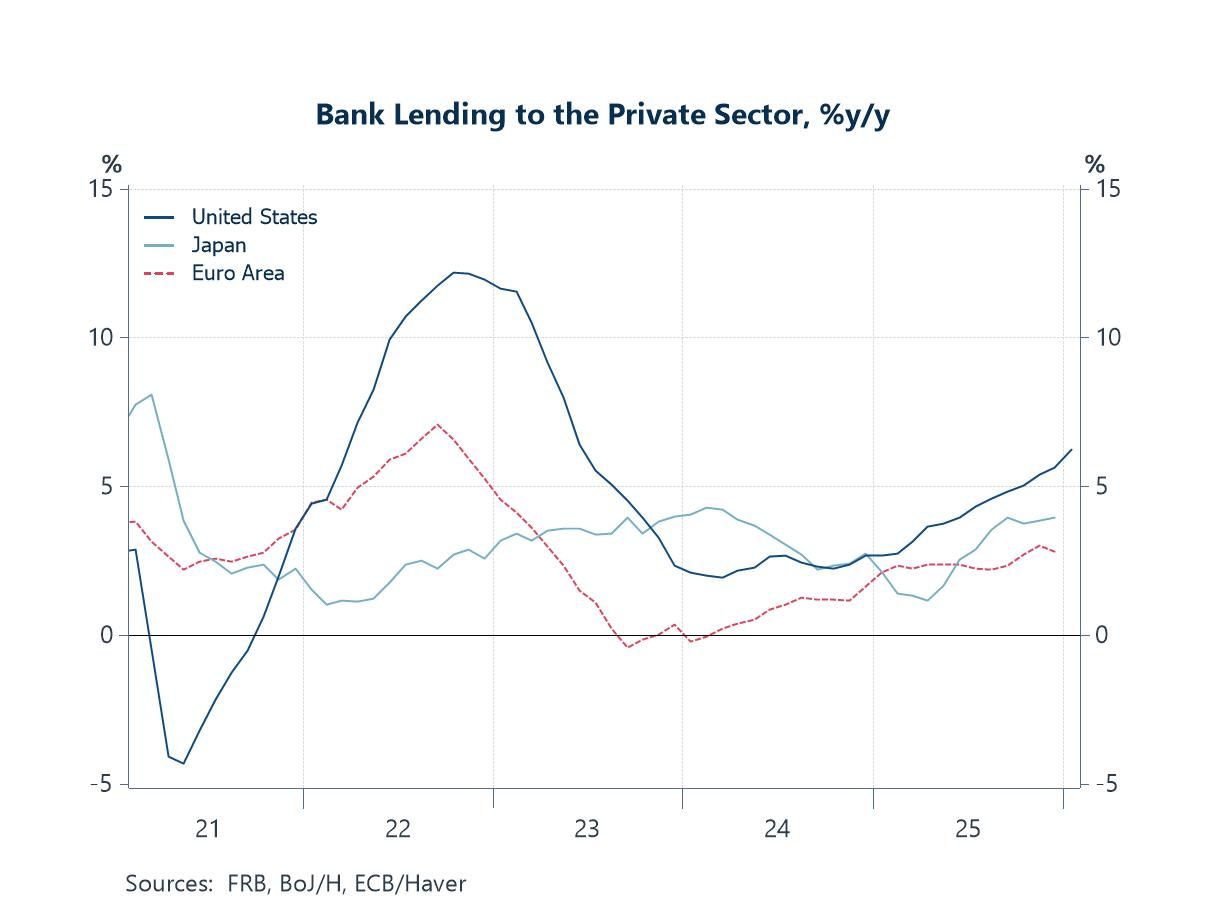
Bank lending growth A key pillar underpinning the still-upbeat tone in global equity markets is the turn in the monetary cycle. As this chart shows, bank lending growth has begun to firm again across several major economies, most notably in the US and Japan, while the euro area has stabilised after last year’s contraction. Recent and prospective rate cuts — alongside earlier liquidity support — are now feeding through into credit creation. Stronger bank lending flows suggest that financial conditions are no longer tightening and may, in fact, be becoming more supportive of activity. For equity investors, this matters: improving credit momentum reinforces the view that the global economy can avoid a hard landing and that policy easing will cushion growth, helping to justify still-elevated valuations.
Chart 2: Private sector lending growth in the US, Japan and euro area
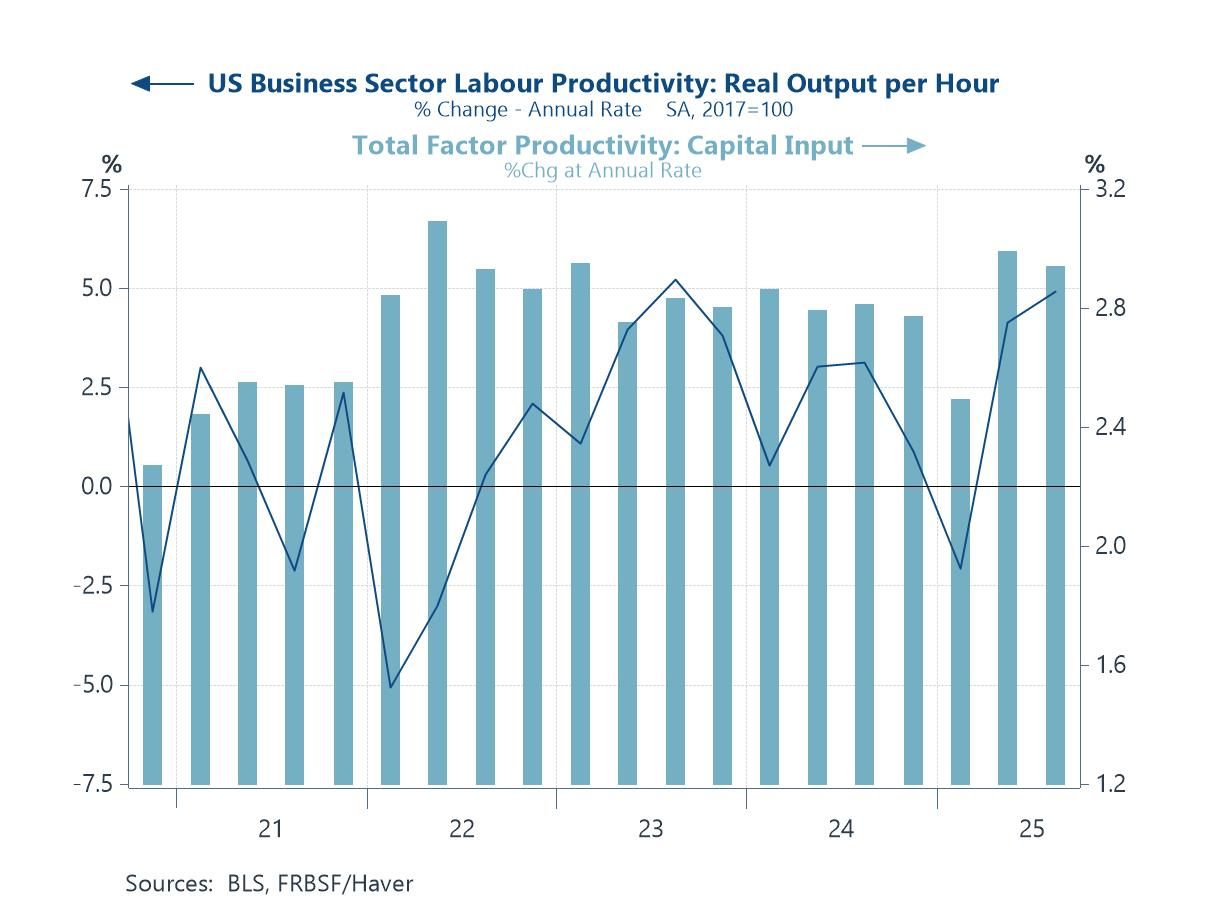
US productivity growth and AI Turning to productivity, the recent improvement in US labour productivity is striking — but its composition matters. As the chart shows, much of the acceleration has coincided with a sharp rise in capital input, reflecting the surge in AI-related infrastructure spending: data centres, semiconductors and high-performance computing. In other words, what we are seeing is primarily a capital-deepening effect — the production of AI — rather than clear evidence that the widespread use of AI is yet transforming efficiency across the broader economy. Total factor productivity, the cleaner measure of underlying technological progress, has not exhibited a sustained breakout. That does not invalidate the AI story — diffusion lags are typical with general-purpose technologies — but it does suggest that markets may be extrapolating productivity gains that have yet to show up convincingly in the data.
Chart 3: The input from capital and US labour productivity growth
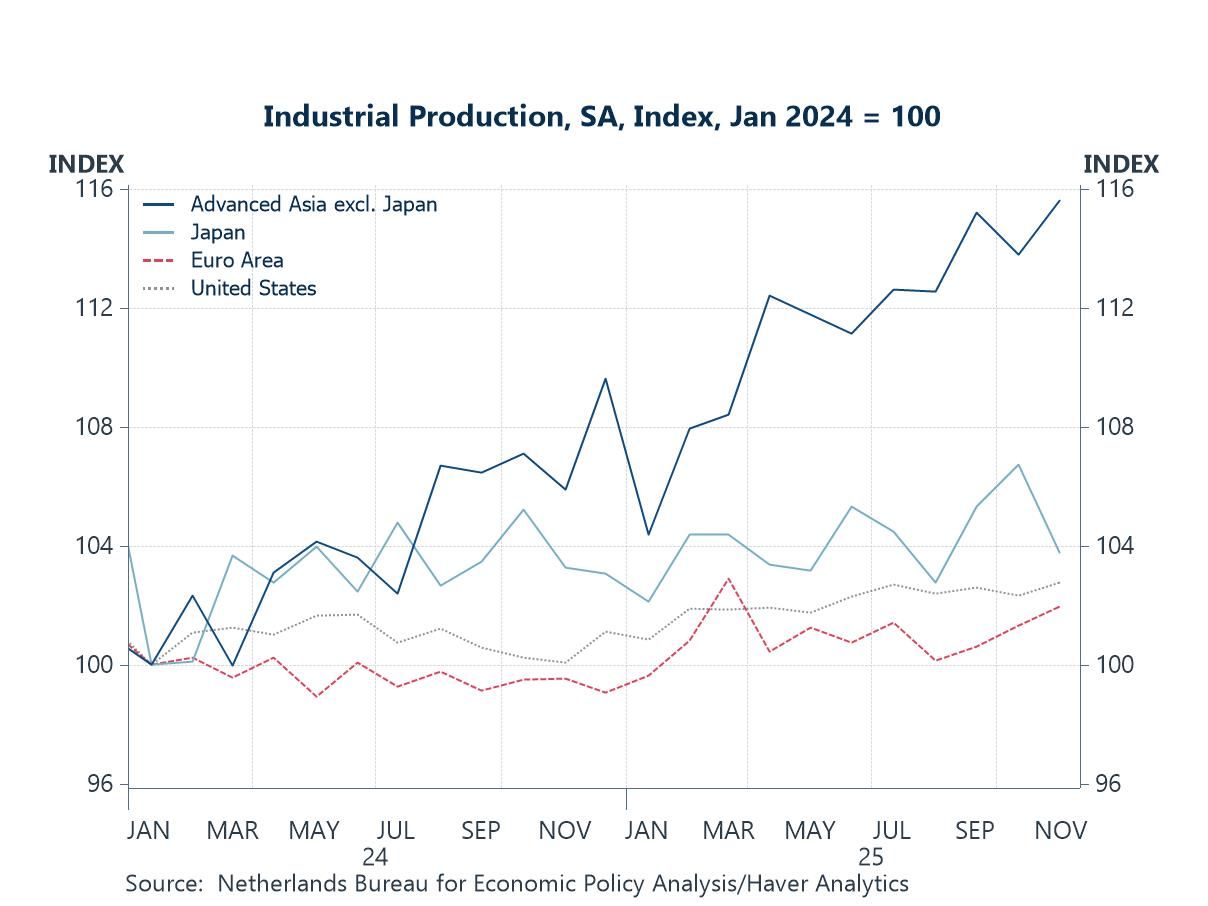
Industrial production in Advanced Asian economies versus the RoW If the productivity story in the US is being driven by the production of AI infrastructure, the industrial production data show where much of the early stages of that production process is physically taking place. Advanced Asia excluding Japan has clearly outperformed, with industrial output rising markedly relative to both the US and the euro area. This divergence neatly reflects the region’s central role in the semiconductor and electronics supply chain — from advanced chip fabrication in Taiwan and Korea to high-end components across the broader region. As AI-related capital expenditure has surged, demand for chips, servers and related hardware has provided a powerful cyclical boost to manufacturing activity in these economies. In that sense, Asia is not merely a passive beneficiary of the AI boom; it sits at its industrial core, supplying the physical backbone of the global AI build-out.
Chart 4: Industrial production in Advanced Asian Economies, Japan, euro area and US
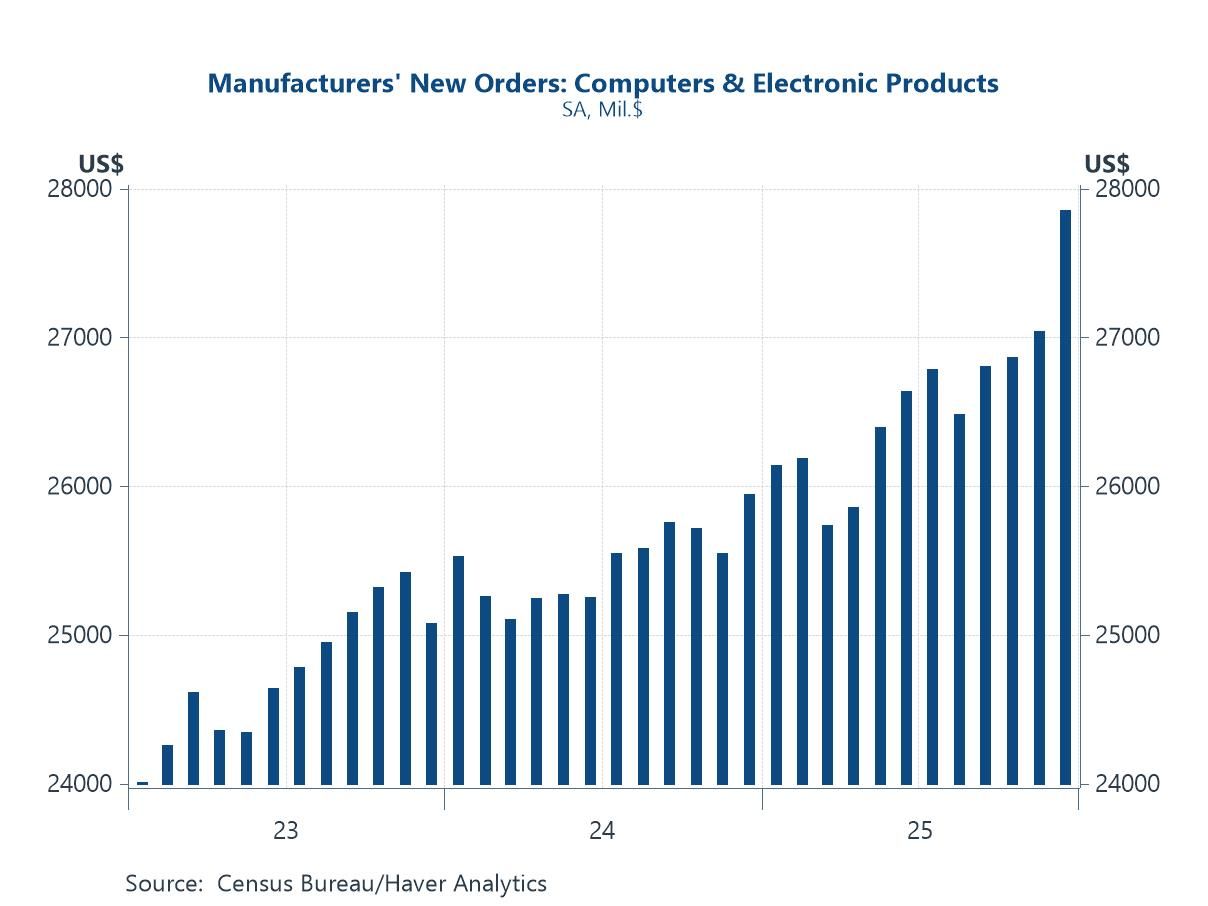
US manufacturing orders of high-tech products The strength in advanced Asia’s industrial production is mirrored by developments in the United States, where new orders for computers and electronic products have continued to climb steadily. As the chart shows, US manufacturers’ orders for high-tech goods — a category that includes semiconductors, communications equipment and other AI-related hardware — have risen to fresh highs in recent months. This reinforces the view that the AI investment cycle remains firmly intact, with strong upstream demand for chips and electronic components feeding through both sides of the Pacific supply chain.
Chart 5: US manufacturing orders of high technology products (including semiconductors)
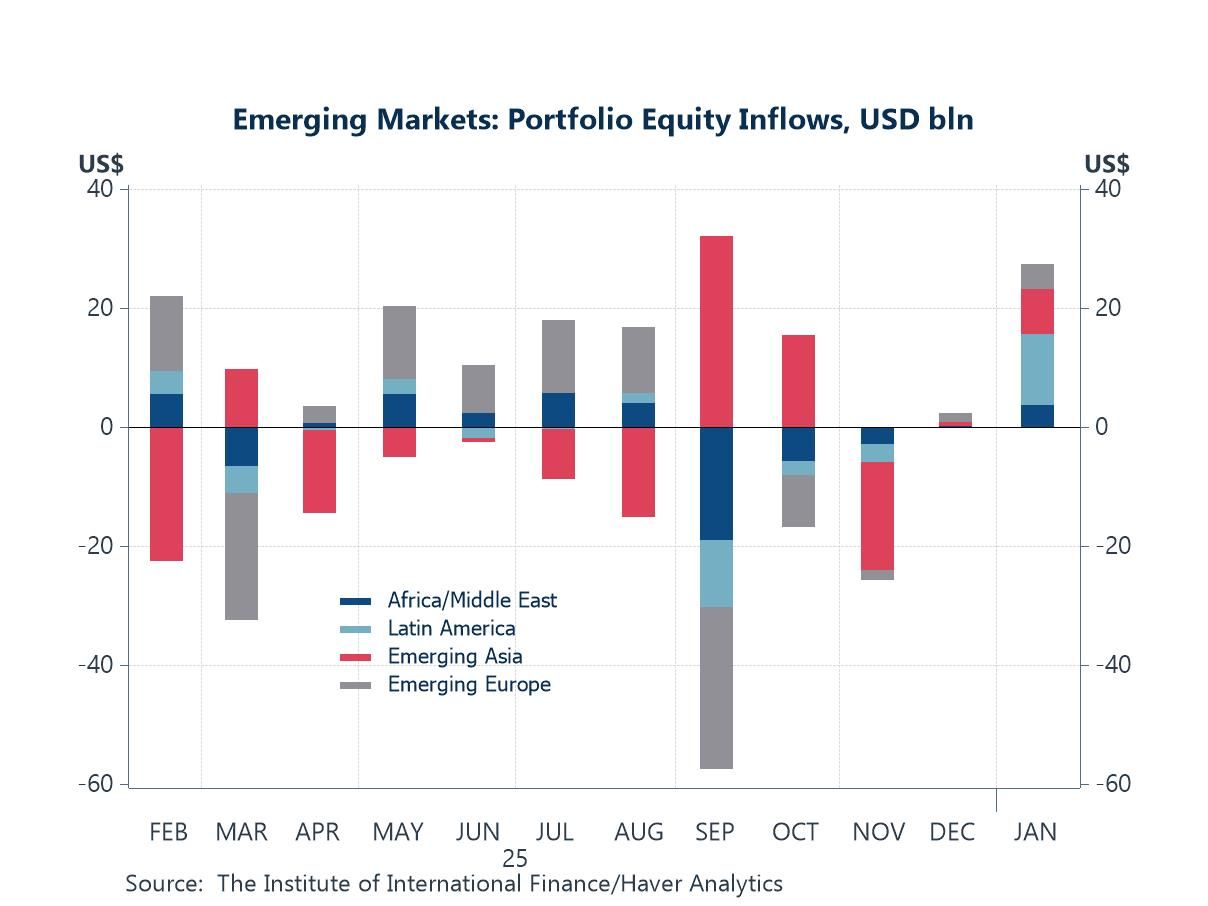
Portfolio flows in Emerging Markets Capital flows are beginning to reflect that same industrial divergence. Emerging market equity inflows have turned more supportive in recent months, with Emerging Asia accounting for a meaningful share of the rebound. This aligns closely with the strength in industrial production across advanced Asia ex Japan, where AI-related demand for semiconductors and hardware has lifted manufacturing momentum. Investors appear increasingly willing to allocate capital toward economies most directly embedded in the AI supply chain. In that sense, the AI infrastructure cycle is not only reshaping trade and production patterns — it is also influencing global portfolio flows, reinforcing Asia’s central role in the current technology-driven upswing.
Chart 6: Portfolio equity flows in Emerging Markets

Andrew Cates
AuthorMore in Author Profile »Andy Cates joined Haver Analytics as a Senior Economist in 2020. Andy has more than 25 years of experience forecasting the global economic outlook and in assessing the implications for policy settings and financial markets. He has held various senior positions in London in a number of Investment Banks including as Head of Developed Markets Economics at Nomura and as Chief Eurozone Economist at RBS. These followed a spell of 21 years as Senior International Economist at UBS, 5 of which were spent in Singapore. Prior to his time in financial services Andy was a UK economist at HM Treasury in London holding positions in the domestic forecasting and macroeconomic modelling units. He has a BA in Economics from the University of York and an MSc in Economics and Econometrics from the University of Southampton.
More Economy in Brief


