U.S. Industrial Production Jumped in January
by:Sandy Batten
|in:Economy in Brief
Summary
- Total industrial output increased a larger-than-expected 0.7% m/m in January.
- However, there were meaningful downward revisions to the previous two months.
- Manufacturing output increased 0.6% m/m, mining declined 0.2% m/m, and utilities production jumped 2.1% m/m.
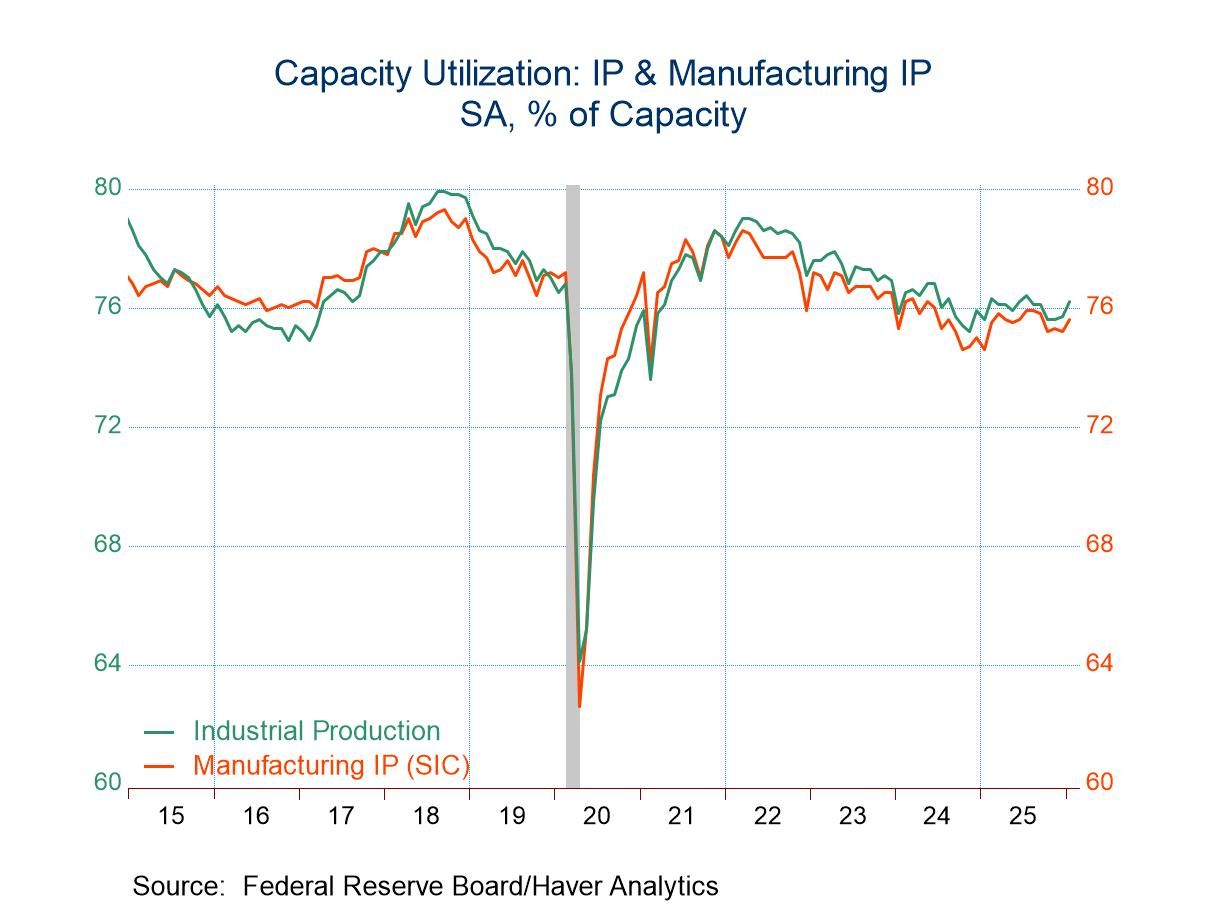
- Rates of capacity utilization edged up in January but remained well below their long-term averages.
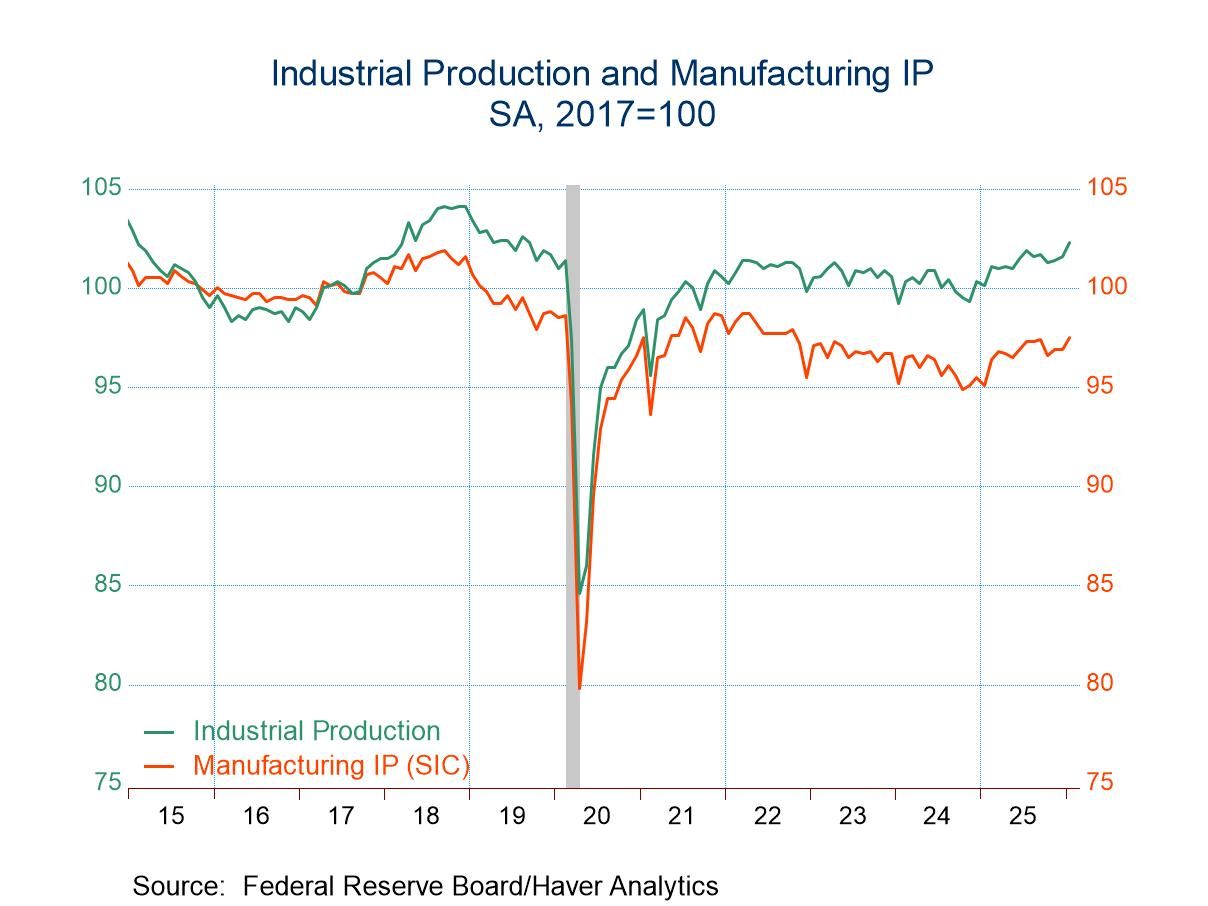
Industrial production (IP) rose a larger-than-expected 0.7% m/m (2.3% y/y) in January following downwardly revised readings for both December (0.2% m/m versus 0.4% m/m previously) and November (0.1% m/m versus 0.4% m/m previously) according to data released by the Federal Reserve Board. The Action Economics Survey looked for a 0.4% monthly gain. The 2.3% annual increase was the second highest since September 2022.
Manufacturing output increased 0.6% y/y (2.4% y/y) in January following a downwardly revised unchanged reading in December (previously +0.2% m/m). Weakness in mining output continued with a 0.2% m/m decline (+2.5%y/y) in January after a downwardly revised 0.9% monthly drop in December (previously -0.7% m/m). This was fourth monthly decline in mining output in the past five months. Reflecting continued unseasonably cold temperatures, utilities output jumped 2.1% m/m (1.1% y/y) in January on top of an upwardly revised 3.0% monthly gain in December (previously 2.6% m/m). This reflected 2.1% monthly gains in both electricity and natural gas distribution.
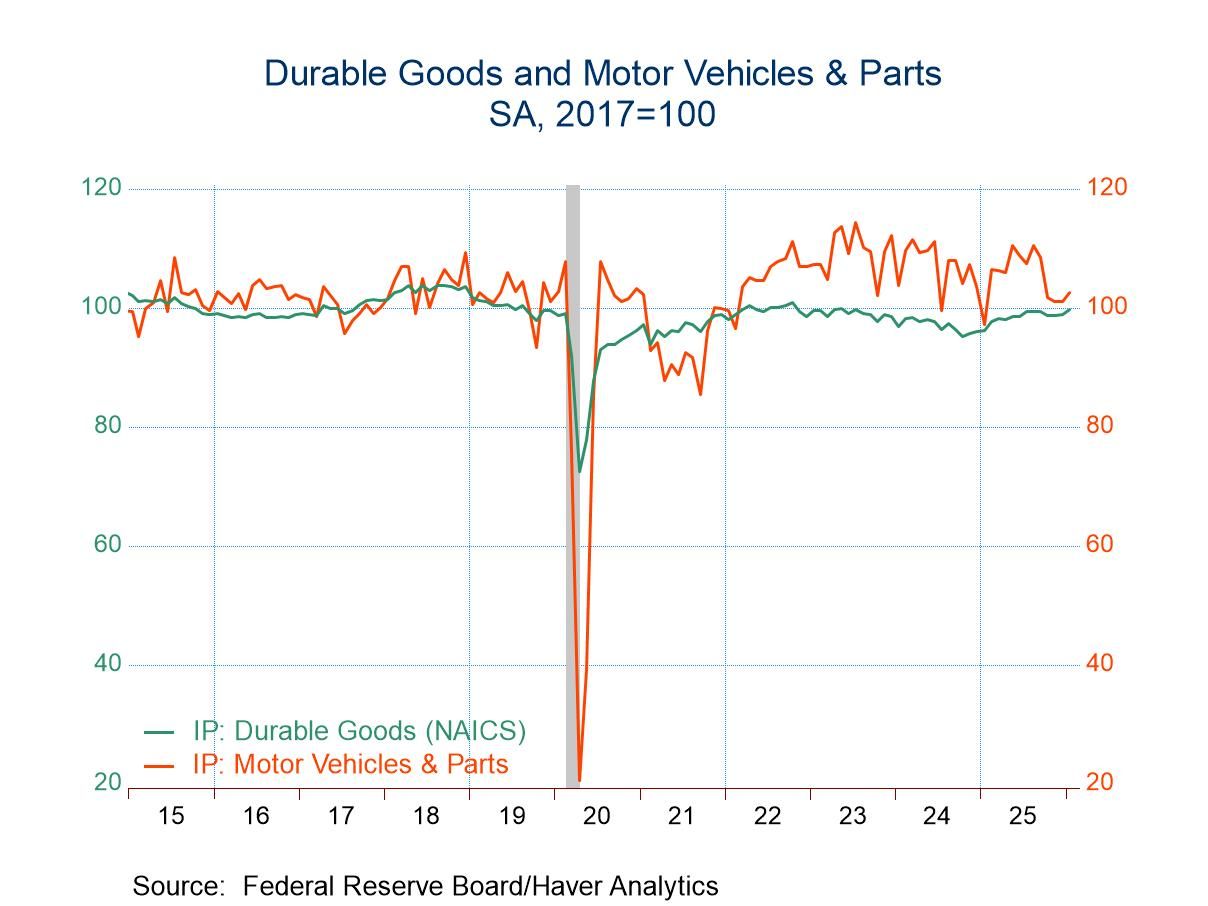
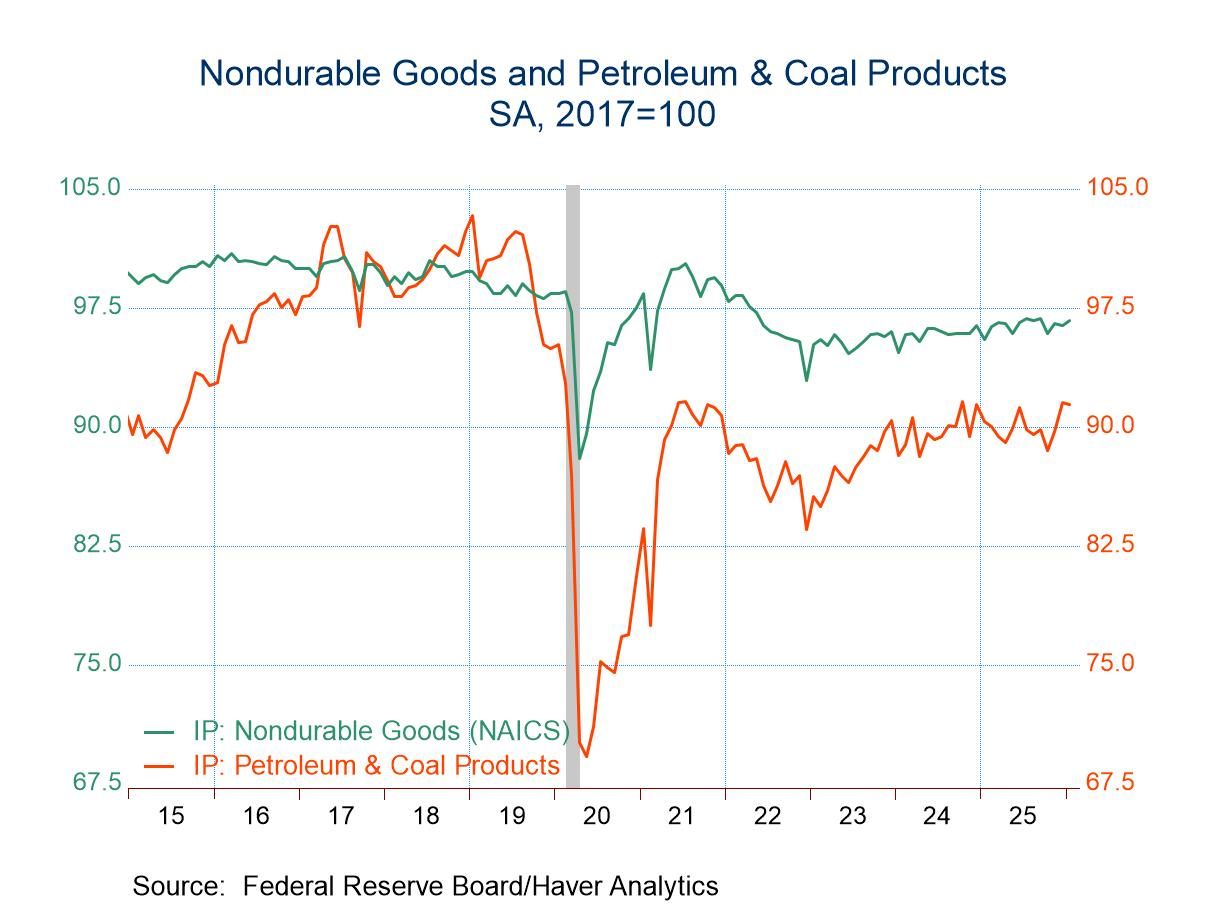
Within manufacturing, durable goods production rose 0.8% m/m (3.7% y/y) in January after a 0.2% monthly increase in December. Gains were widespread across sectors. Production of nonmetallic mineral products increased 2.2% m/m, the first monthly gain in four months. Machinery output increased 1.2% m/m; computer production gained 1.0% m/m; output of motor vehicles rose 1.3% m/m. By contrast, production of aerospace and miscellaneous transportation equipment slipped 0.2% m/m, the second monthly decline in the past three months. Output of nondurable goods increased 0.4% m/m (1.3% y/y) in January, more than reversing a 0.2% monthly decline in December. Performance by sector was varied. Output of plastics and rubber products rose 1.3% m/m in January; chemical production increased 1.1% m/m; paper production gained 0.8% m/m. By contrast, output of apparel and leather goods fell 0.7% m/m, their first monthly decline in three months; food output fell 0.4% m/m; textile output declined 0.3% m/m.
By market groups, output of consumer goods increased 0.7% m/m (1.3% y/y) in January on top of a 0.8% monthly gain in December. Production of business equipment gained 0.9% m/m (9.3% y/y) in January, the same monthly advance as in December. Output of construction supplies rose 0.5% m/m (1.2% y/y) in January, more than reversing the 0.4% monthly decline in December. Output of material increased 0.6% m/m (1.9% y/y) in January after having been unchanged in December from November.
In special classifications, output of selected high-tech industries jumped 1.9% m/m (8.9% y/y) in January, the fourth consecutive monthly gain, following a 0.2% monthly increase in December. Output of motor vehicles and parts rose 1.3% m/m (5.5% y/y) in January after having been unchanged in December. The January gain was led by a 1.9% monthly jump in motor vehicle production. Manufacturing output excluding selected high-tech industries was up 0.6% m/m (2.2% y/y) in January following an unchanged monthly reading in December. Manufacturing output excluding selected high-tech industries and motor vehicles and parts increased 0.5% m/m (2.0% y/y) in January versus unchanged in December.
Capacity utilization rose to 76.2% in January, 3.2%-points below its long-term (1972-2025) average, from a downwardly revised 75.7% in December (previously 76.3%). The January reading was the highest since July. Manufacturing capacity utilization increased to 75.6% in January, 2.6%-points below its long-term (1972-2025) average, from 75.2% in December.
Industrial production and capacity data are in Haver’s USECON database. Additional detail on production and capacity utilization can be found in the IP database. The expectations figures come from the AS1REPNA database.

Sandy Batten
AuthorMore in Author Profile »Sandy Batten has more than 30 years of experience analyzing industrial economies and financial markets and a wide range of experience across the financial services sector, government, and academia. Before joining Haver Analytics, Sandy was a Vice President and Senior Economist at Citibank; Senior Credit Market Analyst at CDC Investment Management, Managing Director at Bear Stearns, and Executive Director at JPMorgan. In 2008, Sandy was named the most accurate US forecaster by the National Association for Business Economics. He is a member of the New York Forecasters Club, NABE, and the American Economic Association. Prior to his time in the financial services sector, Sandy was a Research Officer at the Federal Reserve Bank of St. Louis, Senior Staff Economist on the President’s Council of Economic Advisors, Deputy Assistant Secretary for Economic Policy at the US Treasury, and Economist at the International Monetary Fund. Sandy has taught economics at St. Louis University, Denison University, and Muskingun College. He has published numerous peer-reviewed articles in a wide range of academic publications. He has a B.A. in economics from the University of Richmond and a M.A. and Ph.D. in economics from The Ohio State University.
More Economy in Brief

 Asia
Asia

