 Global| Mar 25 2019
The Flattening Yield Curve – Perhaps It Is Not Different this Time
|in:Viewpoints
Summary
When I last communicated with you regarding matters related to the U.S. economy, on September 4, 2018 (see "The Flattening Yield Curve – Is It Different this Time?"), the spread or difference between the yield on the Treasury 10-year [...]
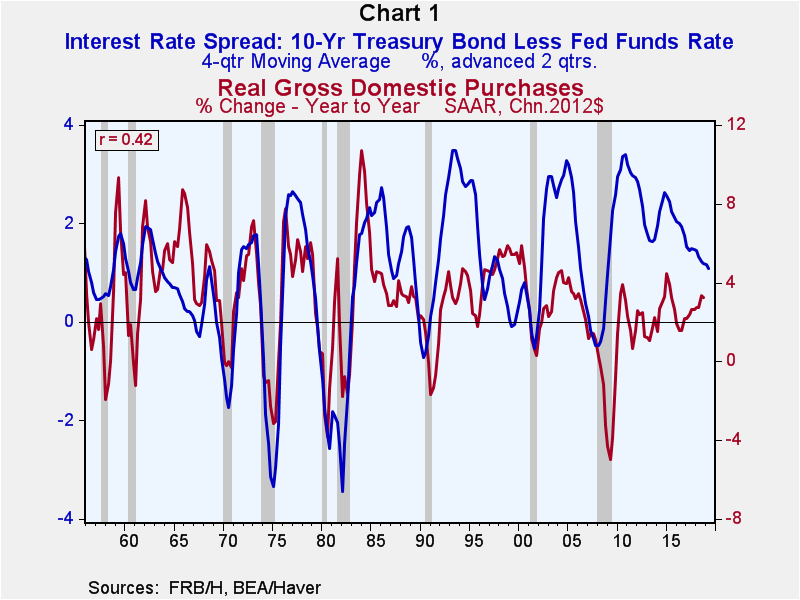 When I last communicated with you regarding matters related to the U.S. economy, on September 4, 2018 (see "The Flattening Yield Curve – Is It Different this Time?"), the spread or difference between the yield on the Treasury 10-year constant maturity security and the federal funds rate was about 0.96 of a percentage point. This spread had narrowed from 2.13 percentage points back in mid-December 2016 when the Fed had started raising the federal funds rate in this cycle. As I write this commentary, the spread has narrowed further to about 0.04 of a percentage point. Way back on September 4, 2018, I had argued that the narrowing in the spread at that point and the expected narrowing in the spread going forward (I had assumed that the Fed would raise the federal funds rate another 0.50 of a percentage point by the end of 2018 and that the yield on the Treasury 10-year security would rise less than the increase in the federal funds rate or even fall), would result in a significant slowing in the growth of U.S. real economic activity. The rationale for my forecast of slowing growth in real economic activity was twofold – history and logic. For the logic, I highly recommend reading my aforementioned commentary of September 4, 2018. For history, see Chart 1 that shows the relationship between the four-quarter moving average of the yield spread and the year-over-year percent change in real Gross Domestic Purchases from 1956 to the present. The highest correlation (0.42) was obtained when the yield spread was advanced by two quarters, implying that the behavior of the yield curve leads the behavior of real aggregate economic activity.
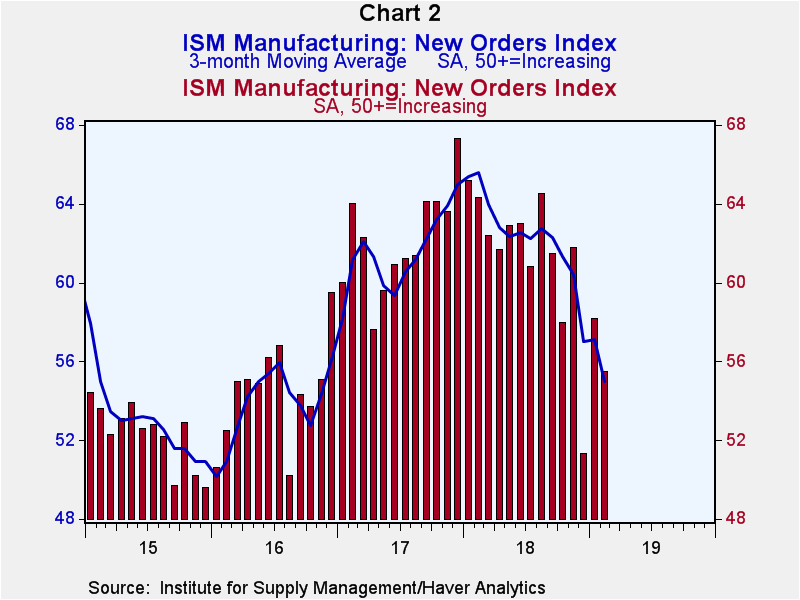
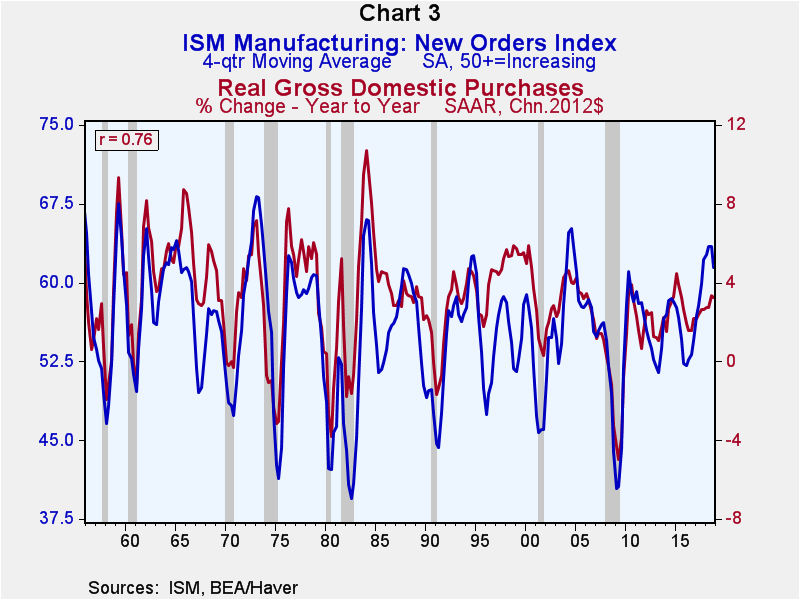
All right, let's see how a few economic indicators subject to minimum revisions have been behaving of late. One of my favorites is the index of new orders in the monthly ISM Manufacturing report. As shown in Chart 2, the three-month moving average of this variable peaked at 65.6 back in February 2018, falling to 55.0 in February 2019. Chart 3 shows that there is a high correlation (0.77) between the four-quarter moving average of ISM Manufacturing new orders index and the year-over-year percent change in real Gross Domestic Purchases. The only revisions to the new orders index are annual updating of seasonal factors. Real Gross Domestic Purchases get revised ad nauseam.
Car and truck sales are another indicator of economic activity that does not get revised except for seasonal factors. Chart 4 shows that they, too, have downshifted of late.
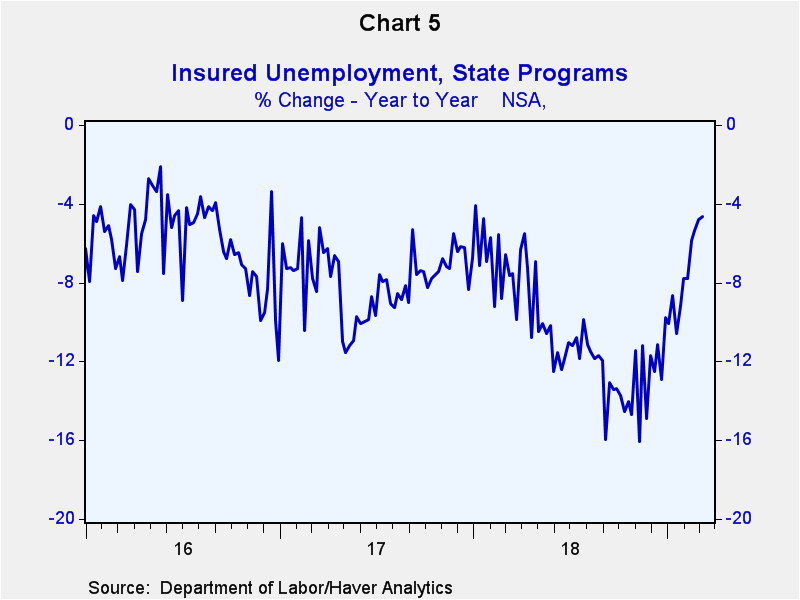
Do you think the February 2019 employment report showing an increase in nonfarm payrolls of just 20,000 was a fluke? I do. But I also think that the U.S. labor market is in the early stage of softening. My evidence of that is the diminution in the rate of contraction of not-seasonally-adjusted continuing claims for unemployment insurance. Continuing claims are an actual count of real people (not a representative sample of people) standing in real lines who have an incentive to be counted. Although the length of the lines is still getting shorter on a year-over-year basis, the rate at which they are shortening is diminishing.
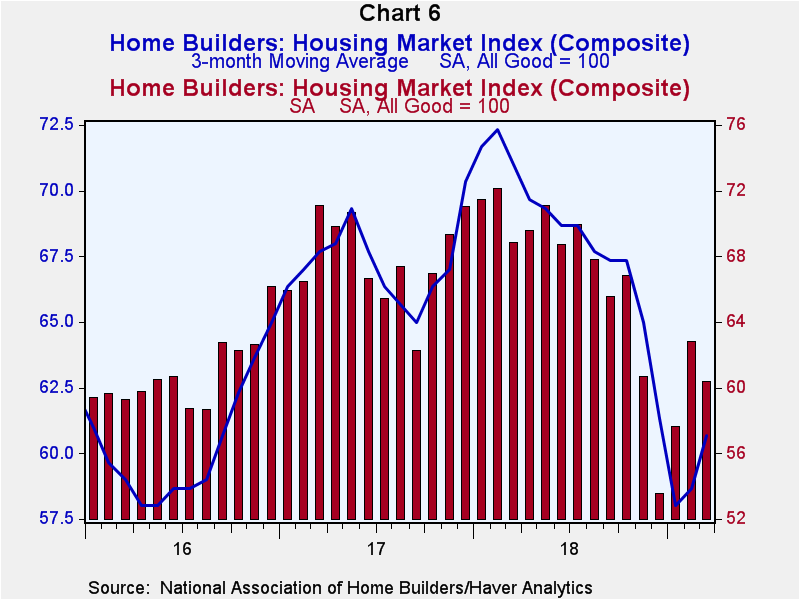
Residential housing is the proverbial canary in the coal mine for signaling cyclical changes in the economy. The National Association of Housing publishes a monthly survey of conditions in the new-home market. Their Housing Market Index (HMI) contains three elements – current new home sales, expected new home sales over the next six months and traffic of prospective homebuyers. To the best of my knowledge, the HMI does not get revised. Although the HMI has staged a rebound in recent months, as shown in Chart 6, it has moved considerably lower from its peak in early 2018.
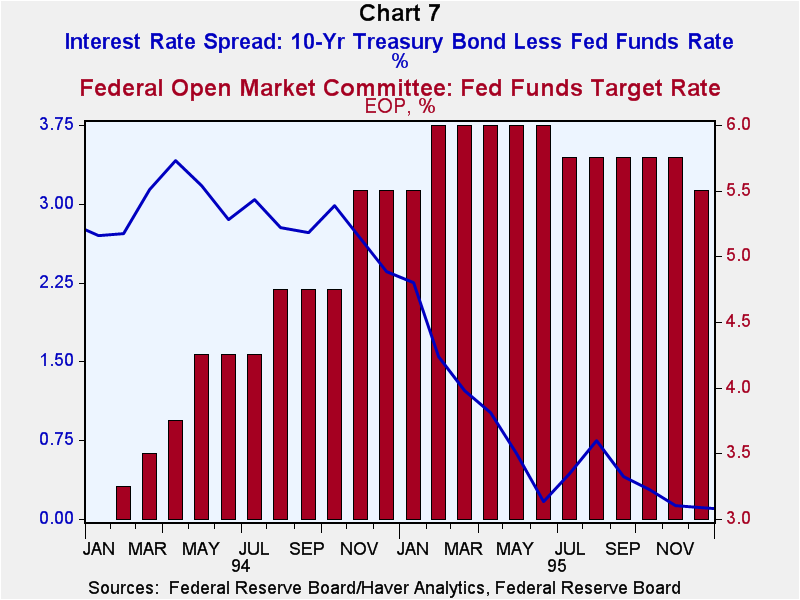
In sum, once again, the behavior of the yield curve has been a good qualitative leading indicator of the pace of real economic activity. The Fed began raising the federal funds rate on a regular basis at the end of 2016 and the spread between the yield on the Treasury 10-year security and the federal funds rate began trending narrower in 2018 – the narrowing in the yield spread being a conclusive indicator that monetary policy was becoming more restrictive. As a result, the pace of economic activity has started to slow. As shown in Chart 7, a similar situation occurred in 1994-95. The Fed started raising the federal funds rate steadily from early 1994 through February 1995. With a lag, the yield spread started narrowing, falling to near zero in June 1995. The pace of economic activity began to slow significantly in early 1995. In July 1995, the Fed lowered the federal funds rate. An outright recession was thereby avoided. The Fed might have to lower the federal funds rate pronto if an outright recession is to be avoided in 2019.
Viewpoint commentaries are the opinions of the author and do not reflect the views of Haver Analytics.Paul L. Kasriel
AuthorMore in Author Profile »Mr. Kasriel is founder of Econtrarian, LLC, an economic-analysis consulting firm. Paul’s economic commentaries can be read on his blog, The Econtrarian. After 25 years of employment at The Northern Trust Company of Chicago, Paul retired from the chief economist position at the end of April 2012. Prior to joining The Northern Trust Company in August 1986, Paul was on the official staff of the Federal Reserve Bank of Chicago in the economic research department. Paul is a recipient of the annual Lawrence R. Klein award for the most accurate economic forecast over a four-year period among the approximately 50 participants in the Blue Chip Economic Indicators forecast survey. In January 2009, both The Wall Street Journal and Forbes cited Paul as one of the few economists who identified early on the formation of the housing bubble and the economic and financial market havoc that would ensue after the bubble inevitably burst. Under Paul’s leadership, The Northern Trust’s economic website was ranked in the top ten “most interesting” by The Wall Street Journal. Paul is the co-author of a book entitled Seven Indicators That Move Markets (McGraw-Hill, 2002). Paul resides on the beautiful peninsula of Door County, Wisconsin where he sails his salty 1967 Pearson Commander 26, sings in a community choir and struggles to learn how to play the bass guitar (actually the bass ukulele). Paul can be contacted by email at econtrarian@gmail.com or by telephone at 1-920-559-0375.


