Inflation, the General Price Level and Relative Prices
|in:Viewpoints
Several years ago, when inflation had decelerated from its high peaks, I published an article in the Wall Street Journal about inflation and the Fed. It’s always an honor to get a piece in the WSJ, but one of the hazards is the WSJ holds the right to put any title on the article that it wishes. In almost all cases, the WSJ’s title is far better than the ones I have submitted. For my article on October 26, 2023, I liked my title, “Lower Inflation but Higher Prices” more than the title the WSJ used: “We’re Still Paying for the Federal Reserve’s Blunders”.
Both titles still apply to the current situation. PCE inflation is 2.7% and CPI inflation is 3.0%--which may seem modest, but the cumulative increase in prices for goods and services is the primary focus of consumers. It directly influences their standards of living, their perceptions of confidence and their assessments of government leadership. Meanwhile, the focus of financial markets and the Fed is nearly exclusively on the rate of inflation and changes in the rate, to the tenth of a percent and beyond. Presently, even amid lack of government data, the focus in financial markets is the extent to which PCE inflation is above the Fed’s 2% target, and what is the appropriate policy rate that would eventually reduce inflation to 2%.
This note considers the cumulative increase in the level of price increases in recent years and adds in an important element—how relative prices of different goods and services have changed, particularly some of the things we purchase on a regular basis—food and drink. Prices of some goods and services have gone up much more or less than others. Presumably, this is affecting household pocketbooks and our spending patterns.
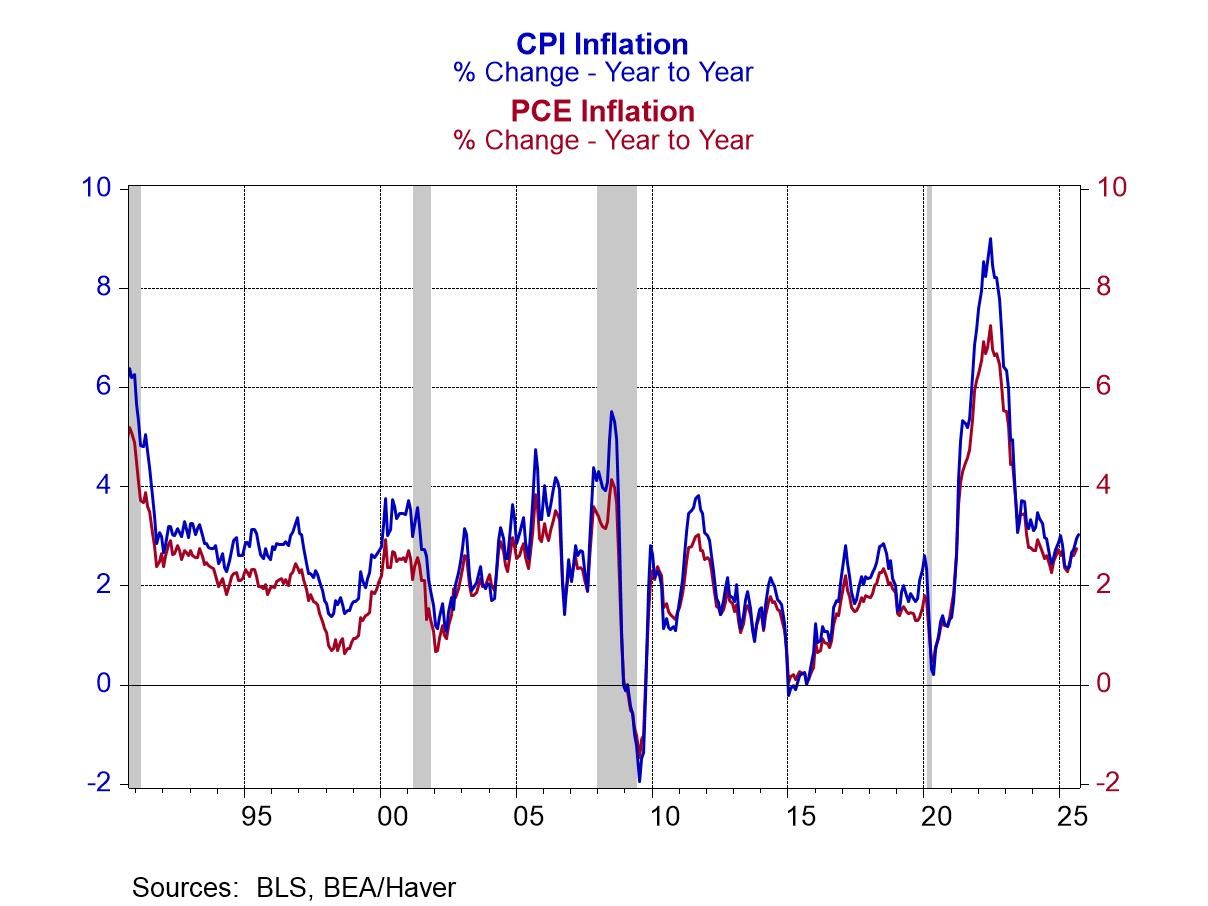
The trend in inflation. As shown in Charts 1 and 2, CPI and PCE inflation have settled down but the cumulative increase in the general price level has been striking—since pre-Covid, measured as 2019Q4, the CPI is up 26.9% and the PCE is up 22.3%. That’s the biggest cumulative increase in prices over a short number of years since the 1970s. (It’s nearly unimaginable that during the Great Inflation between 1966 and 1982, the CPI rose 300%...while the S&P500 rose 150%). Nevertheless, the recent surge in the general price level comes as a rude awakening following the stable and relatively low inflation that persisted in the decade following the Great Financial Crisis.
Two quick footnotes. First, while the PCE Price Index provides a more comprehensive measure of inflation by including prices of all goods and services consumed, the CPI is a much better measure of consumers’ out-of-pocket expenses. The PCE is a price index of all consumption, whereas the CPI does not include prices of goods and services that are financed by third party payers, including health care services financed by Medicare, Medicaid and employer health insurance. Accordingly, the CPI has a significantly higher weighting of housing services (rental costs and owners’ equivalent rent of residencies, or OER) while the PCE has a much higher weighting of health services.
Chart 1. CPI and PCE Price Index, 2019Q4=100
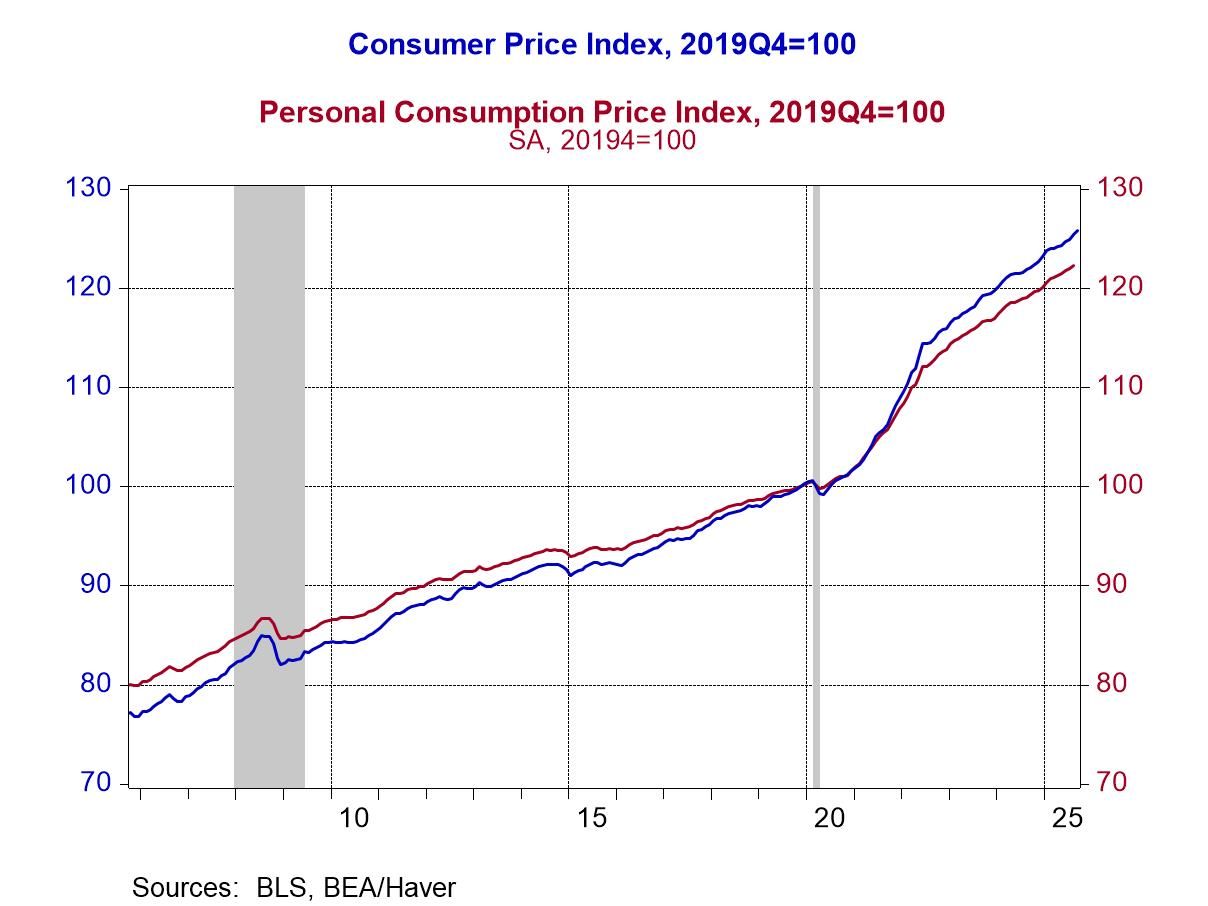
Chart 2. CPI and PCE Inflation, yr/yr %chg
Second, both the CPI and PCE are measured on a quality-adjusted basis. The monthly data on prices for the CPI and PCE Price Index are adjusted for estimated changes in quality by the Bureau of Economic Analysis (BEA). These estimates of quality adjustment are a critical input to the official inflation data. Particularly for new or updated products, these estimates of quality adjustment rely on hedonic regression analyses, with a moderate dose of subjectivity. Of note, the BEA does not make public any of its estimating procedures or empirical work, and it is virtually impossible to obtain such valuable historical data. Too bad, it would provide a wonderful history of product innovation and advance.
Pre- and post-Covid trends. Besides the acceleration of inflation, there has been a distinct shift in the trend of inflation and prices of durable and nondurable goods and services. This is displayed in Chart 3, which shows the year-over-year inflation of durable and nondurable goods and services, and in Chart 4, which shows the level of the PCE price index for durables, nondurables and services.
From 1995 until the onset of Covid, quality-adjusted prices of durable goods declined. Prices of goods purchased increased, but those increases were more than offset by estimated improvements in quality. The quality improvement was most apparent in computers, but also motor vehicles and other durable goods. As a result, deflation in durable goods persisted over the entire period. Consider the price of a new automobile over the period and the BLS’s measure in quality-adjusted terms: the average new car cost $19,757 in 1995 and $38,950 in 2019, a 97% cumulative rise; the BLS estimates that in quality adjusted terms, the price of the average new car rose 2.4% over the entire period. During this long period, the average annual recorded decline in durable goods prices was 2.8%. At the same time, prices of nondurable goods fluctuated, primarily reflecting trends in prices of energy, and generally they rose, averaging a 2.1% rise annually. Inflation of services, which constitute approximately 65% of total consumption, averaged 2.8% annually. Many services remain labor intensive, and in some service-producing sectors, output is measured as the cost of inputs. Of note, the measurement of inflation of a portion of services are imputed, including housing expenses and some medical expenses.
Chart 3. PCE Inflation for Services and Durable and Nondurable Goods
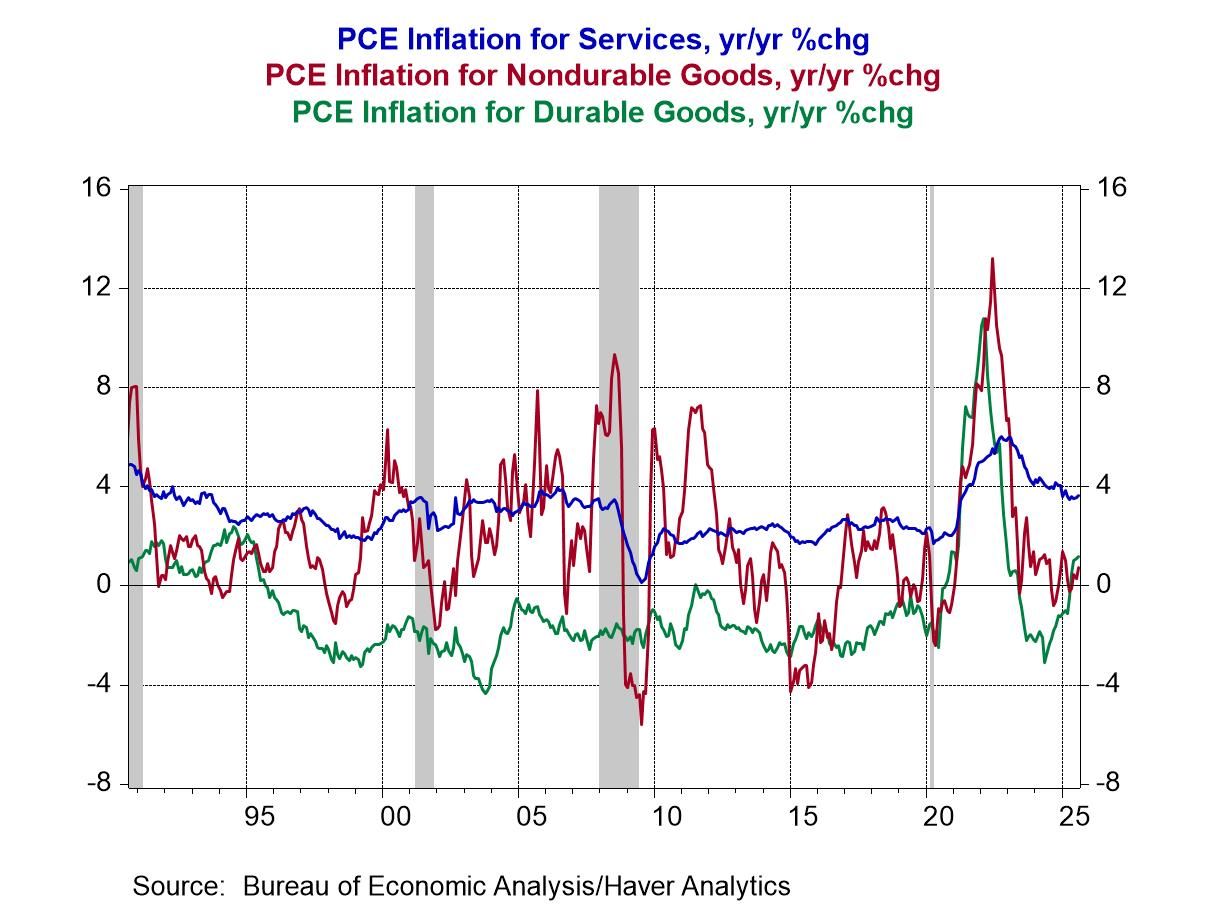
Chart 4. PCE Price Index for Services and Durable and Nondurable Goods

Those trends in inflation have shifted distinctly since Covid. Services inflation has continued, but at a markedly higher pace. Inflation of durable and nondurable goods surged through 2023 and since then prices of durables have fallen while prices of nondurables have been flat.
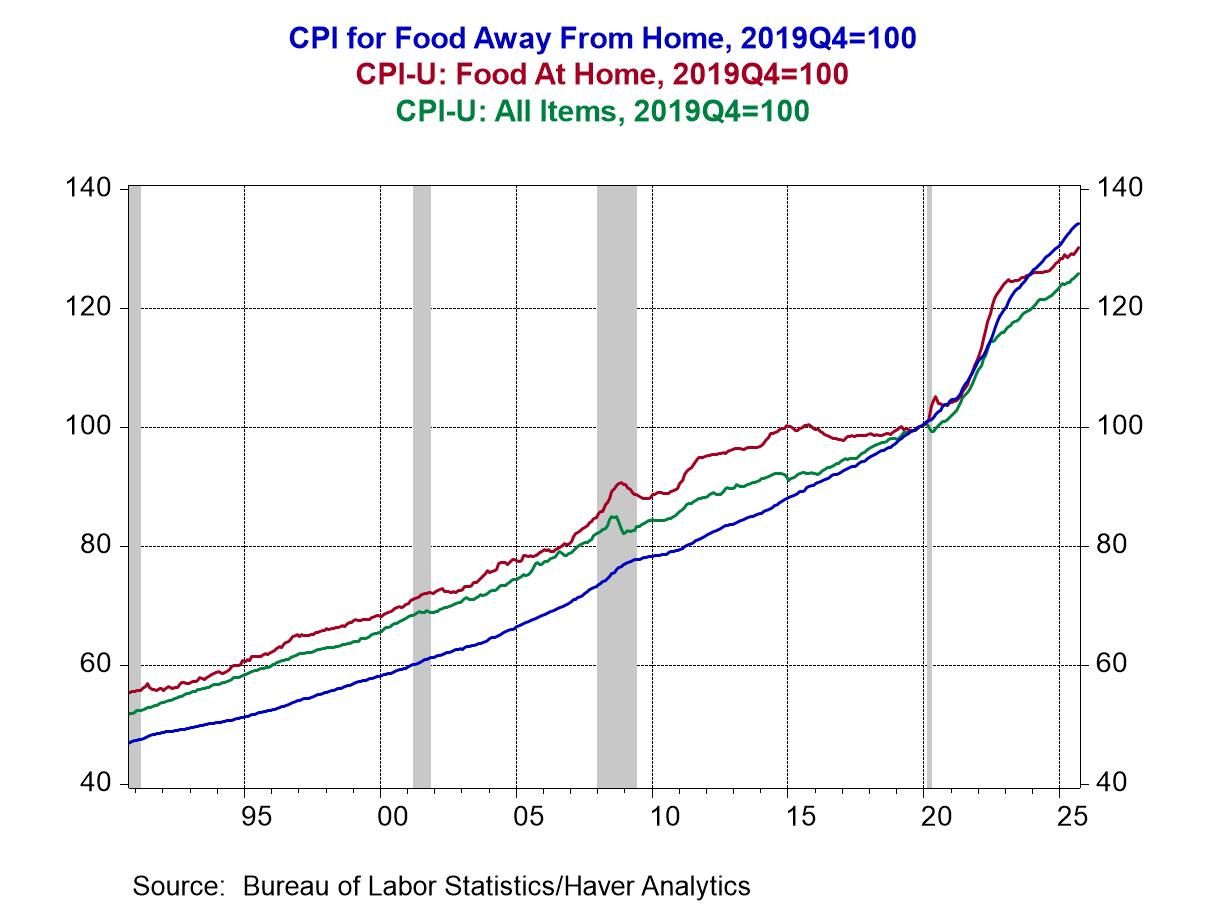
Price changes of what we eat and drink. Prices of food, which constitutes 13.7% of the CPI basket of all goods and services, have risen cumulative more than the overall CPI, and prices of food consumed away from home have risen substantially more than the prices of food consumed at home (Chart 5). Note that food consumed away from home includes employer cafeterias and schools, which drags down the higher cost increases of restaurants. Not surprisingly, the higher costs of food consumed away from home reflect the costs of labor and rents and higher costs of insurance of proprietors, all of which have risen faster than the CPI. Add in tips and taxes, and the relative cost of eating and drinking away from home has risen significantly in absolute and relative terms.
Chart 5. Costs of Food, Cumulative Changes since 2019Q4=100
Consider what we eat and drink: there have been significant changes in relative prices. Prices of some frequently eaten items have zoomed, while others have risen by less, and prices of select items have fallen. This reflects shifts in supply and production and distribution costs more so than shifts in trends in aggregate or product demand. Futures prices provide rich details. Charts 6 and 7 show the cumulative percentage changes in prices measured from 2019Q4. In the last nearly five years the onset of Covid, the cumulative price increase of wheat has been 10%, while prices of soybeans and corn have increased close to average inflation.
Chart 6. Cumulative Price Changes Since 2019Q4=100: Soybeans, Corn and Wheat
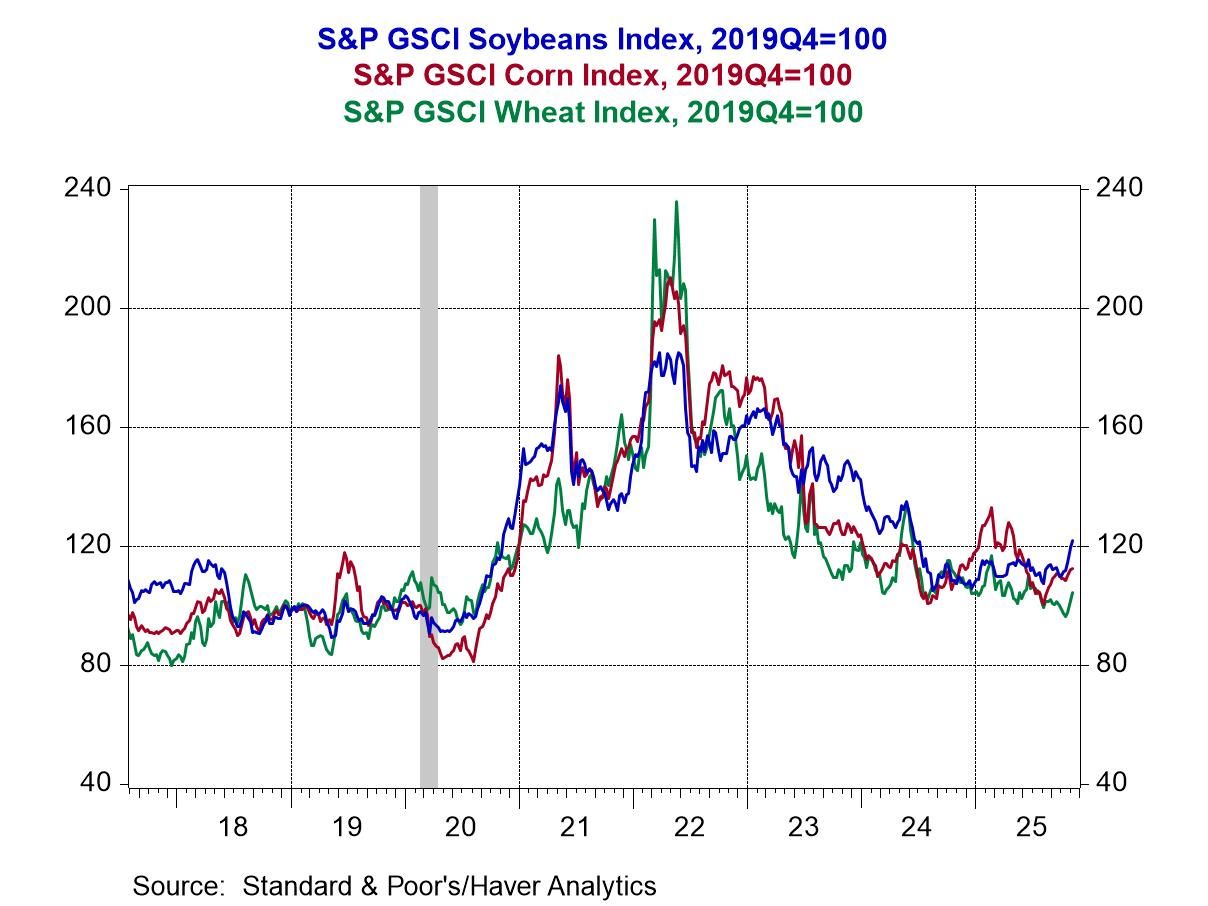
Chart 7. Cumulative Price Changes Since 2019Q4: Eggs and Cheese
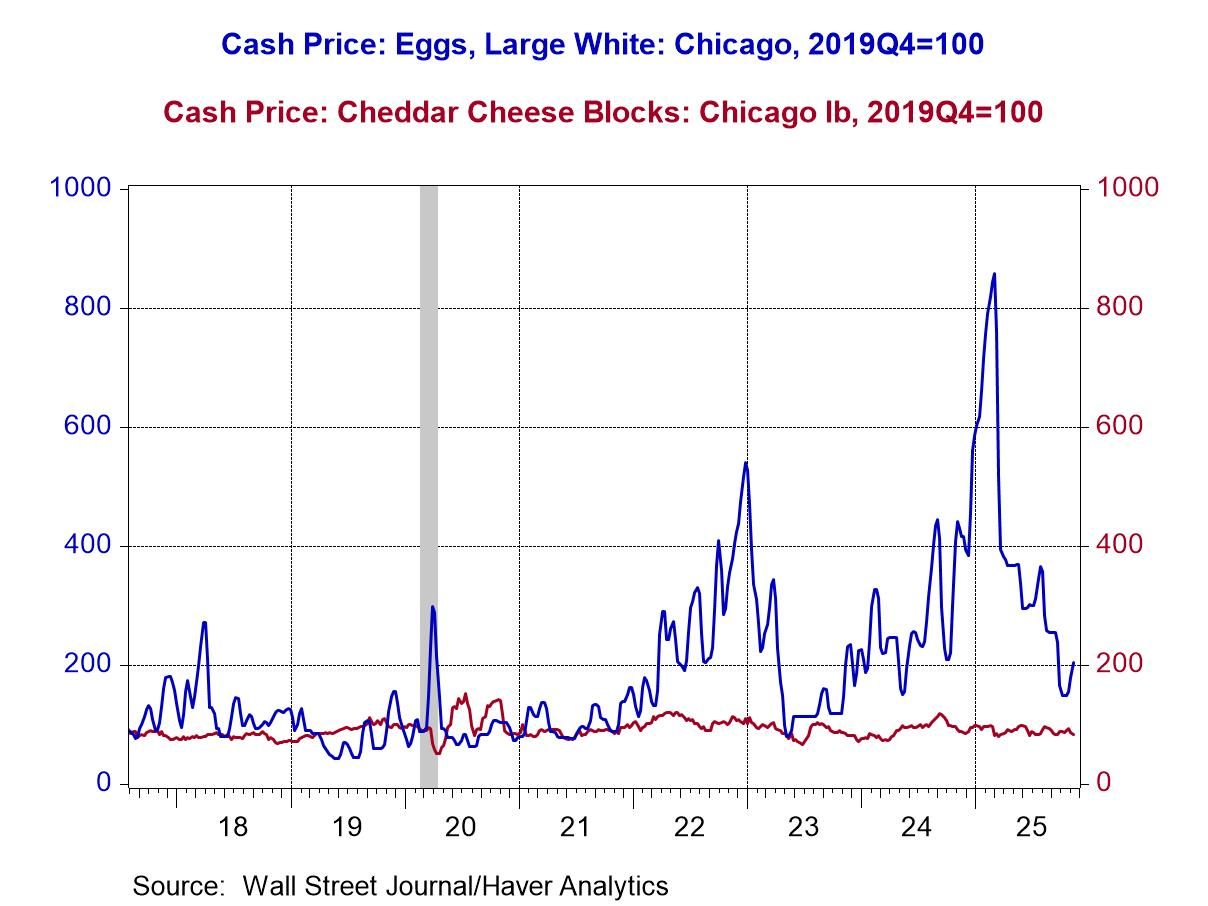
Prices of cheese (and butter, not shown) have fallen. Eggs are another story: their prices soared over 800% in early 2025 and have receded sharply, but remain double their pre-Covid prices. Beef prices have doubled since pre-covid, while the cumulative price increase of poultry has been modest (Chart 8).
Bad news for coffee drinkers: coffee futures are up 380% from their 2019Q4 price (Chart 9). The largest purveyors of coffee hedge their costs of future supplies of coffee, but nevertheless pass on the costs to consumers. Still, brewing a cup of coffee at home is far less expensive than purchasing one at a coffee shop. Similar bad news for those who consume chocolate products: cacao prices soared through 2024 and have since fallen but remain nearly 250% of their pre-covid level. Sugar prices nearly doubled from 2019Q4 through 2024, but since then they have fallen back close to its pre-covid level.
Chart 8. Cumulative Price Changes Since 2019Q4: Beef, Pork and Poultry
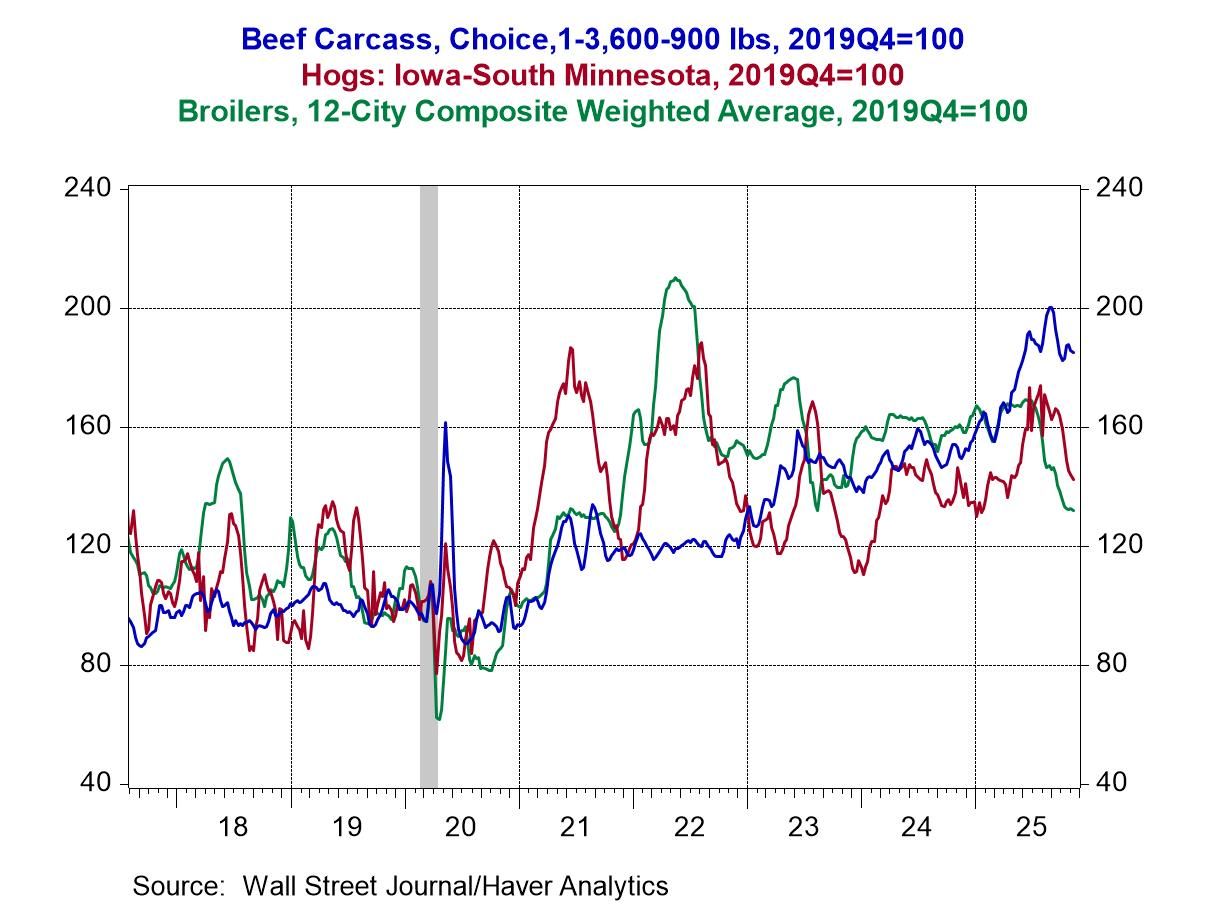
Chart 9. Cumulative Price Changes Since 2019Q4: Coffee, Cocoa & Sugar
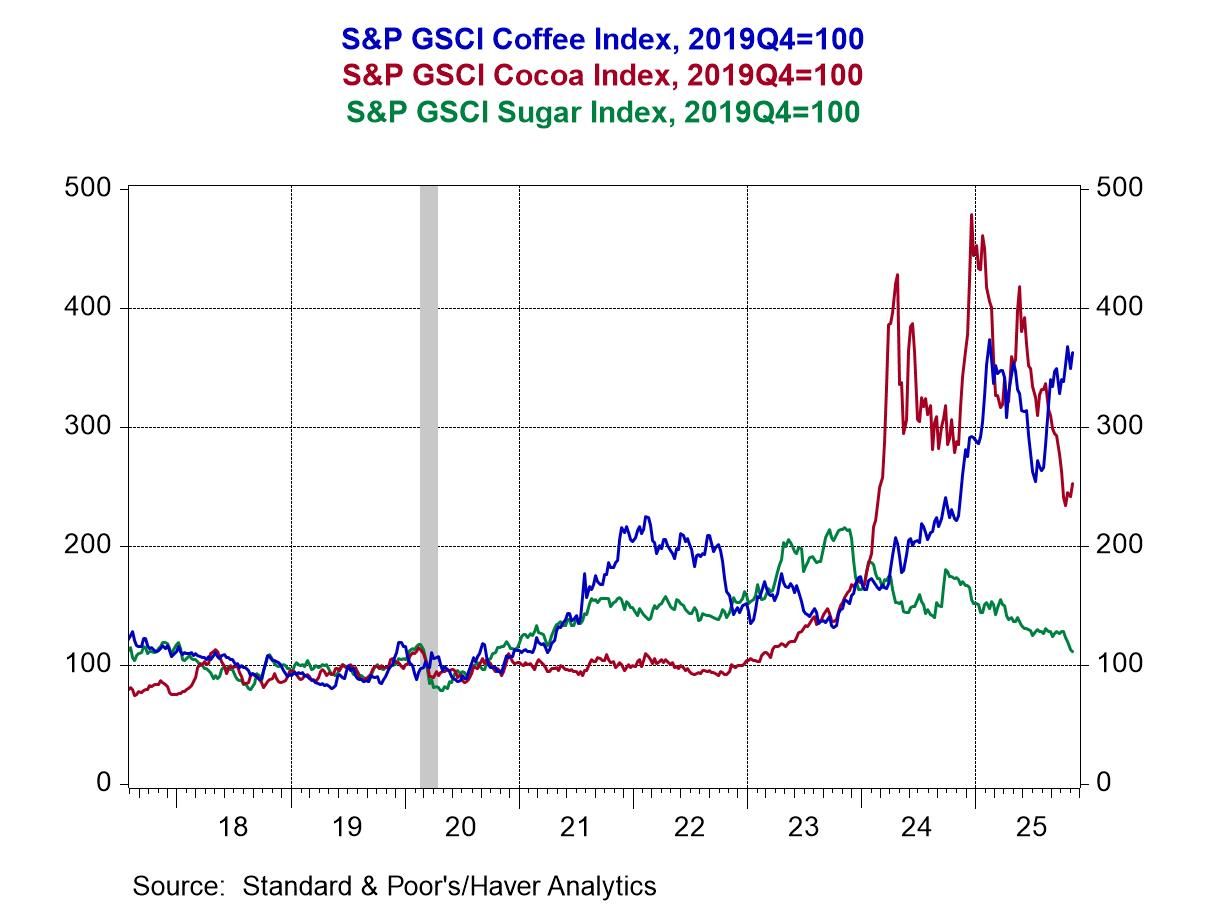
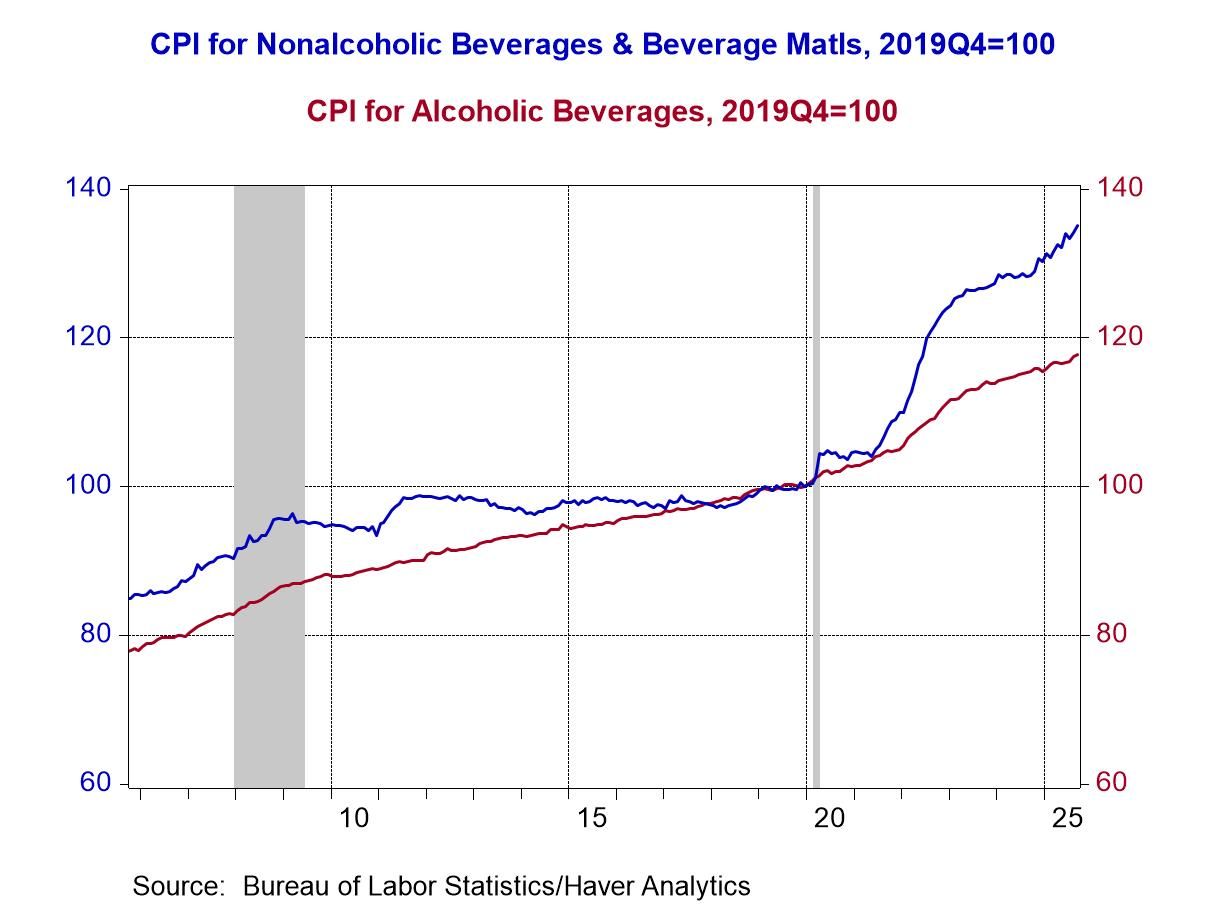
Chart 10 shows that prices of alcoholic beverages have risen roughly twice as fast as prices of nonalcoholic beverages since pre-Covid. This finding may run counter to preconceived notions that demand for alcoholic beverages rose significantly during Covid. Most likely, it’s the high costs of labor and sugar that go into nonalcoholic beverages that makes the difference.
Chart 10: Cumulative Price Changes since 2019Q4: Alcoholic and Nonalcoholic Beverages
Concluding remark. There’s a lot more to the inflation story than how financial markets and the Fed respond to the next data print. While inflation hovers only modestly above the Fed’s target, the cumulative rise in the general price level since just before Covid is striking. High prices and changes in relative prices are having a marked impact on spending patterns and standards of living, and are resonating with of a sizable portion of the population. Maybe the WSJ was right after all: “We’re Still Paying for the Federal Reserve’s Blunders”!

Mickey D. Levy
AuthorMore in Author Profile »Mickey Levy is a macroeconomist who uniquely analyzes economic and financial market performance and how they are affected by monetary and fiscal policies. Dr. Levy started his career conducting research at the Congressional Budget Office and American Enterprise Institute, and for many years was Chief Economist at Bank of America, followed by Berenberg Capital Markets. He is a Visiting Fellow at the Hoover Institution at Stanford University and a long-standing member of the Shadow Open Market Committee.
Dr. Levy is a leading expert on the Federal Reserve’s monetary policy, with a deep understanding of fiscal policy and how they interact. He has researched and spoken extensively on financial market behavior, and has a strong track record in forecasting. Dr. Levy’s early research was on the Fed’s debt monetization and different aspects of the government’s public finances. He has written hundreds of articles and papers for leading economic journals on U.S. and global economic conditions. He has testified frequently before the U.S. Congress on monetary and fiscal policies, banking and credit conditions, regulations, and global trade, and is a frequent contributor to the Wall Street Journal.
He is a member of the Council on Foreign Relations and the Economic Club of New York, and previously served on the Panel of Economic Advisors to the Federal Reserve of New York, as well as the Advisory Panel of the Office of Financial Research.
Dr. Levy holds a Ph.D. in Economics from University of Maryland, a Master’s in Public Policy from U.C. Berkeley, and a B.A. in Economics from U.C. Santa Barbara.