 Global| Apr 15 2009
Year-to-Year Drop In U.S. CPI IsFirst Since '55 Thanks To Energy & Food Prices
by:Tom Moeller
|in:Economy in Brief
Summary
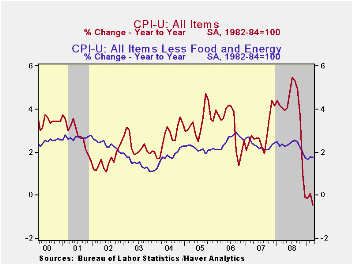
Last month, the consumer price index published by the Bureau of Labor Statistics slipped 0.1%. The big news, however, was not the rare negative sign in front of the monthly figure but the negative sign in front of the twelve month [...]
 Last month,
the consumer price index published by the Bureau of Labor Statistics
slipped 0.1%. The big news, however, was not the rare negative sign in
front of the monthly figure but the negative sign in front of the
twelve month change. It was the first time since August 1955 that the
figure was negative. (Negative prints a few months ago reflected the
effects of seasonal adjustment factors.) The latest slip in the CPI
contrasts with Consensus expectations for a 0.2% March rise.
Last month,
the consumer price index published by the Bureau of Labor Statistics
slipped 0.1%. The big news, however, was not the rare negative sign in
front of the monthly figure but the negative sign in front of the
twelve month change. It was the first time since August 1955 that the
figure was negative. (Negative prints a few months ago reflected the
effects of seasonal adjustment factors.) The latest slip in the CPI
contrasts with Consensus expectations for a 0.2% March rise.
Leading that decline in prices was a reversal of earlier strength in energy & food costs. In contrast, "core" pricing recently picked up a bit. The CPI less food & energy rose 0.2% in each of the last three months and these increases actually were stronger than the -0.0% and 0.1% changes during the last four months of 2008. That pickup was enough to stabilize the twelve month change near 1.8% after its deceleration from a high of 2.9% back in September of 2006.
Lower energy prices in March were led by a 4.0% decline gasoline prices (-39.3% y/y) which reversed just half of the February increase. Even weaker last month were fuel oil prices which fell 7.7%. That was the eighth consecutive monthly drop and it lowered prices by nearly one-third during the last twelve. Similarly, prices for natural gas & electricity have fallen in all but one of the last eight months though they still were 2.6% higher than last March.
 Moderation
of earlier gains in food &
beverage prices also has played a role in the overall CPI deceleration.
Prices slipped another 0.1% last month and the annual gain of 4.3% is
down from a peak of 6.1% last fall. Recent weakness has been led by
lower dairy product prices (-3.1% y/y) as prices of other foods
continued higher.
Moderation
of earlier gains in food &
beverage prices also has played a role in the overall CPI deceleration.
Prices slipped another 0.1% last month and the annual gain of 4.3% is
down from a peak of 6.1% last fall. Recent weakness has been led by
lower dairy product prices (-3.1% y/y) as prices of other foods
continued higher.
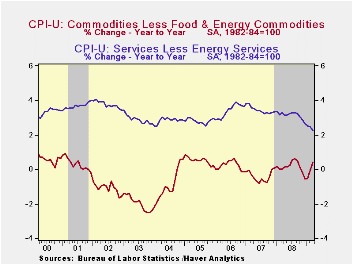
Core goods prices have been up notably in recent months. The second consecutive 0.4% increase in March reversed all of the weakness since 2006. Higher tobacco prices account for much of that acceleration as they rose 18.1% year to year. But there has been some modest firming of prices elsewhere. Prices for household furnishings & operations show a 1.8% y/y gain following price deflation early last year. Prices of new & used motor vehicles also stopped declining during the last three months though they still are down 0.8% y/y. Apparel prices are up 1.4% y/y after modest deflation due to the weak Christmas.
Gains in core
services prices continue to moderate. The 0.1% upticks
during five of the last six months pulled year-to-year change to 2.3%
which was its lowest since 1983. That moderation continues to owe
mostly to weakness in the housing market which caused March shelter
prices to be unchanged and up just 1.5% y/y. 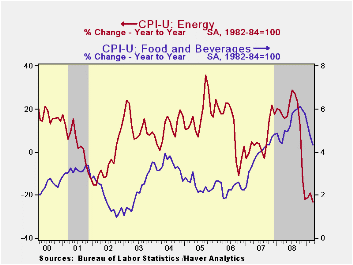 Owners equivalent rent of
primary residence, a measure not equivalent to other house price
measures, rose 0.2% (2.1% y/y) The cost of travel fell and prices of
lodging away from home have also dropped, by 7.8% during the last year.
Other service prices rose. The increase in medical care services prices
fell back to 0.2% (3.1% y/y) while education costs rose 0.5% (5.6%
y/y). Public transportation prices fell hard as they did
during the prior month. The 1.0% decline was the seventh drop in a row
(-5.0% y/y).
Owners equivalent rent of
primary residence, a measure not equivalent to other house price
measures, rose 0.2% (2.1% y/y) The cost of travel fell and prices of
lodging away from home have also dropped, by 7.8% during the last year.
Other service prices rose. The increase in medical care services prices
fell back to 0.2% (3.1% y/y) while education costs rose 0.5% (5.6%
y/y). Public transportation prices fell hard as they did
during the prior month. The 1.0% decline was the seventh drop in a row
(-5.0% y/y).
The chained CPI, which adjusts for shifts in consumption patterns, eased to a gain of just 0.2%. The increase in chained prices less food and energy continued firm at 0.4%. · The consumer price data is available in Haver's USECON database while detailed figures can be found in the CPIDATA database.
| Consumer Price Index (%) | March | February | Y/Y | 2008 | 2007 | 2006 |
|---|---|---|---|---|---|---|
| Total | -0.1 | 0.4 | -0.4 | 3.8 | 2.9 | 3.2 |
| Total less Food & Energy | 0.2 | 0.2 | 1.8 | 2.3 | 2.3 | 2.5 |
| Goods less Food & Energy | 0.4 | 0.4 | 0.4 | 0.1 | -0.4 | 0.2 |
| Services less Energy | 0.1 | 0.1 | 2.3 | 3.1 | 3.4 | 3.4 |
| Energy | -3.0 | 3.3 | -23.1 | 13.5 | 5.7 | 11.0 |
| Food & Beverages | -0.1 | -0.1 | 4.3 | 5.4 | 3.9 | 2.3 |
| Chained CPI: Total (NSA) | 0.2 | 0.6 | -0.8 | 3.3 | 2.5 | 2.9 |
| Total less Food & Energy | 0.4 | 0.4 | 1.3 | 2.0 | 2.0 | 2.2 |
by Robert Brusca April 15, 2009
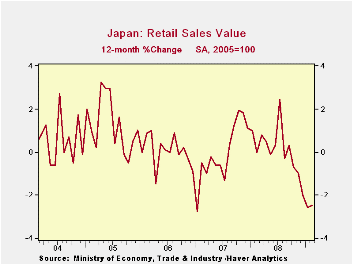
Japans economy continues to show the strains it is under as
retail spending fell again in February. The 0.2% drop is a step-up from
the 0.1% drop in January which comes on the heels of December’s 1.7%
sales collapse. As a result of this sequence of sales results, Japan’s
retail sales in 2009-Q1 are falling at a 6.6% nominal rate. Nominal
sales are off by only about 2.5% Yr/Yr (seasonally adjusted) since
retail sales in Japan only began falling consistently starting in
October of last year. Over three months sales are off at a 7.8% annual
rate; over six months the decline is at a 5.5% annual rate.
In addition industrial output in Japan fell by 9.4% in
February after a sharper drop of 10.1% in January. These ARE
month-to-month drops in overall industrial output. Japan’s industrial
sector is being gutted by the sharp contraction in global trade. Japan
remains an economy under a great deal of pressure.
| Japan Retail Sales Trends | ||||||||
|---|---|---|---|---|---|---|---|---|
| Feb-09 | Jan-09 | Dec-08 | 3-mo | 6-mo | 12-mo | Yr-Ago | Q-to-Date | |
| Total SA | -0.2% | -0.1% | -1.7% | -7.8% | -5.5% | -2.5% | 0.0% | -6.6% |
| Not seasonally adjusted | ||||||||
| Total: Nominal | -1.2% | 0.9% | -2.5% | -10.9% | -7.3% | -5.7% | 13.0% | -6.4% |
| Motor Vehicles | -6.1% | 3.7% | 4.3% | 6.1% | -7.7% | -5.4% | 13.1% | 6.7% |
| Food& Beverage | -1.5% | -0.5% | -1.4% | -12.9% | -3.1% | -0.6% | 8.9% | -9.1% |
| Fabric apparel & access | 0.0% | 1.7% | -6.3% | -17.6% | -6.9% | -7.2% | 8.3% | -5.8% |
| Rest of Retail | -0.1% | 1.0% | -4.0% | -11.8% | -9.8% | -8.5% | 16.2% | -7.5% |
by Tom Moeller April 15, 2009
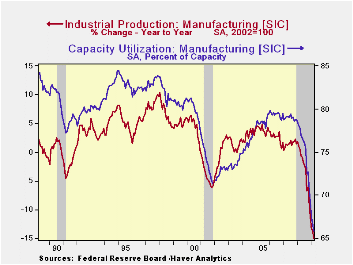
In March, the year-to-year decline in U.S. industrial output of 12.7% was the result of reduced U.S. demand, inventory cutbacks and recessions abroad. To emphasize the size of that decline, it was the largest since the factory sector's wind-down following World War II.
It's the same story as earlier for the U.S. industrial sector. Output fell 1.5% last month, the same as an unrevised 1.5% drop during February. For 2008 and 2007, however, production was revised weaker. Consensus expectations had been for a 0.9% decline in March output.
And the rate of decline has picked up steam. During the last
three months, the rate of decline of 18.5% (AR) about matches the
quickest of the last few months. Factory sector output alone is off at
an 18.7% annual rate during the last three months versus a full-year
drop of 3.2% during 2008.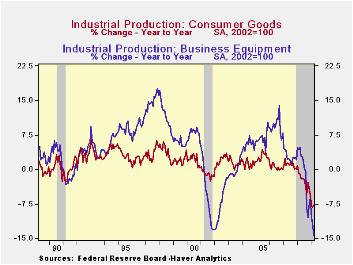
The downturn in the housing market continued to lower output of construction supplies which fell 2.7% last month and at a 30.0% annual rate during the last three. Output of consumer goods overall fell 0.4% last month and at a 12.5% rate since so far this year. Production of autos fell at a 37.3% rate while furniture output fell at a 21.9% rate so far this year after the 10.5% drop during all of 2008. Apparel output actually posted a modest March increase but it's off at a 16.5% rate so far in 2009. Production of business equipment continued lower last month by 2.4% and at a 27.6% rate for the year.
Pain has come to an area which previously was immune. Industrial production in the high-tech sector fell another 3.1% last month and at a 23.8% rate during the last three. That follows a downwardly revised 11.4% increase during all of last year. Less high tech, overall industrial production fell 1.5% during March and the annual rate of change of -18.5% was near the weakest since 1975.
Outside of the both the auto and the high tech sectors, total factory production fell 1.5% last month and the three-month annual rate of decline remained more than firm at -16.8%.
Excess capacity grew even further last month. Capacity utilization fell to 69.3%, a record low for the series which dates to 1966. Utilization in the factory sector dropped even harder to 65.8% from a peak near 80% back in 2007. The latest rate was a record low since WW II. Growth in the total productive capacity of the factory sector has slowed to 0.5% (y/y) and the growth during the last two years was revised down.
The industrial production data are available in Haver's USECON database.
| INDUSTRIAL PRODUCTION (SA, %) | March | February | Y/Y | 2008 | 2007 | 2006 |
|---|---|---|---|---|---|---|
| Total Output | -1.5 | -1.5 | -12.7 | -2.2 | 1.5 | 2.3 |
| Manufacturing | -1.7 | -0.6 | -15.0 | -3.2 | 1.4 | 2.5 |
| Consumer Goods | -0.4 | -0.7 | -7.8 | -2.6 | 0.9 | 0.4 |
| Business Equipment | -2.4 | -1.5 | -14.4 | -1.1 | 2.7 | 9.4 |
| Construction Supplies | -2.7 | -2.0 | -21.0 | -6.3 | -2.0 | 2.3 |
| Utilities | 1.9 | -7.8 | -2.8 | 0.3 | 3.4 | -0.6 |
| Capacity Utilization | 69.3 | 70.3 | 79.8 (March '08) | 77.6 | 80.6 | 80.9 |

Tom Moeller
AuthorMore in Author Profile »Prior to joining Haver Analytics in 2000, Mr. Moeller worked as the Economist at Chancellor Capital Management from 1985 to 1999. There, he developed comprehensive economic forecasts and interpreted economic data for equity and fixed income portfolio managers. Also at Chancellor, Mr. Moeller worked as an equity analyst and was responsible for researching and rating companies in the economically sensitive automobile and housing industries for investment in Chancellor’s equity portfolio. Prior to joining Chancellor, Mr. Moeller was an Economist at Citibank from 1979 to 1984. He also analyzed pricing behavior in the metals industry for the Council on Wage and Price Stability in Washington, D.C. In 1999, Mr. Moeller received the award for most accurate forecast from the Forecasters' Club of New York. From 1990 to 1992 he was President of the New York Association for Business Economists. Mr. Moeller earned an M.B.A. in Finance from Fordham University, where he graduated in 1987. He holds a Bachelor of Arts in Economics from George Washington University.
More Economy in Brief


