 Global| Nov 11 2009
Weekly Chain Store Sales SlipFollowing Several Lackluster Weeks
by:Tom Moeller
|in:Economy in Brief
Summary
It appears that consumer malaise continued early this month. During the latest week, chain store sales slipped 0.1% after having been roughly unchanged during October and down moderately in September. Nevertheless, the sharp down- [...]
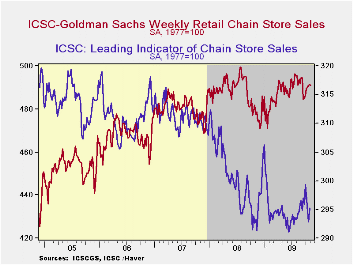 It appears
that consumer malaise continued early this month. During the latest
week, chain store sales slipped 0.1% after having been roughly
unchanged during October and down moderately in September.
Nevertheless, the sharp down-trend in sales of earlier this year
appears over.
It appears
that consumer malaise continued early this month. During the latest
week, chain store sales slipped 0.1% after having been roughly
unchanged during October and down moderately in September.
Nevertheless, the sharp down-trend in sales of earlier this year
appears over.
The ICSC-Goldman Sachs retail chain-store sales index is constructed using the same-store sales (stores open for one year) reported by 78 stores of seven retailers: Dayton Hudson, Federated, Kmart, May, J.C. Penney, Sears and Wal-Mart.
During the last ten years there has been a 69% correlation between the year-to-year growth in chain store sales and the growth in general merchandise retail sales. The weekly figures are available in Haver's SURVEYW database.
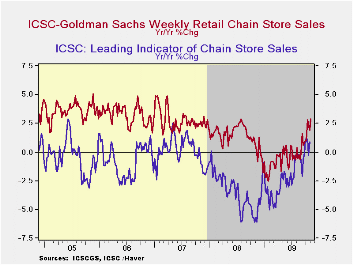 Prospects
for an improvement in sales continue to appear limited. The
leading indicator of sales has been roughly unchanged since the spring
of this year. On the other hand, a backslide in spending also seems
unlikely. The sharp declines of the leading indicator of sales from
2007 to early-2009 are over.
Prospects
for an improvement in sales continue to appear limited. The
leading indicator of sales has been roughly unchanged since the spring
of this year. On the other hand, a backslide in spending also seems
unlikely. The sharp declines of the leading indicator of sales from
2007 to early-2009 are over.
This composite leading economic indicator
is compiled from four series: (1) the MBA's volume index of mortgage
applications
for home purchase (2) the ABC News/Money magazine's survey of consumer
buying conditions (3) new filings for jobless benefits and (4) the
30-year government bond yield.
Employment growth: Cyclical movements or structural change from the Federal Reserve Bank of Chicago is available here .
The Current State of the Economy and a Look to the Future (With Reference to William ‘Sidestroke’ Miles, W. Somerset Maugham, Don Ameche and Kenneth Arrow) is the title of yesterday's speech by Dallas Fed Governor Richard W. Fisher and it can be found here
| ICSC-UBS (SA, 1977=100) | 11/07/09 | 10/31/09 | Y/Y | 2008 | 2007 | 2006 |
|---|---|---|---|---|---|---|
| Total Weekly Chain Store Sales | 490.9 | 491.3 | 2.9% | 1.4% | 2.8% | 3.3% |
by Tom Moeller November 11, 2009
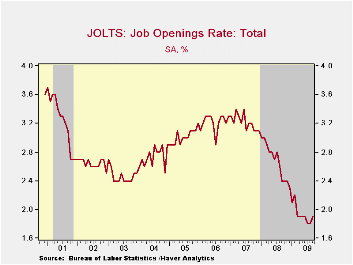
The Bureau of Labor Statistics reported in its Job Openings
& Labor Turnover Survey (JOLTS) that job availability improved
during September by 2.4% from August. The rise in the number
of job openings followed a 0.6% August uptick that was
revised from the initial report of a slight decline. Despite these
improvements, however, openings were off 25.9% from September of last
year. The series dates back to December 2000.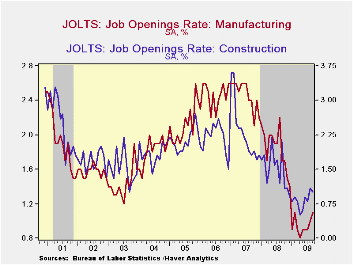
Factory sector job openings rose sharply for the second
consecutive month but they
remained down 42.4% y/y. The recent rise in the actual
number of construction sector job openings paused last month. Though
still down 59.2% y/y in September, openings were roughly double the
series' low reached in February. The
level of professional & business services job openings posted
its second consecutive monthly gain (-25.2% y/y) and education
& health sectors job openings (-12.3% y/y) reversed most of an
August decline. Openings in retail trade have risen slightly from their
April low (-9.8% y/y) while government sector job openings reflected
reduced tax revenues and fell to a new series' low (-38.1% y/y.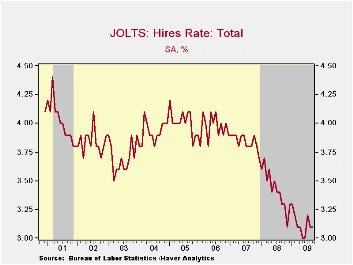
The job openings rate rose slightly from the series' low reached this summer to 1.9%. These rates were down from more than 3% in 2007. Recent gains have been led by the factory & construction sectors. The job openings rate is the number of job openings on the last business day of the month as a percent of total employment plus job openings.
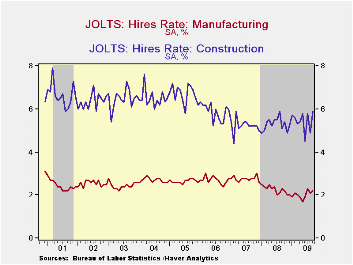
The hires rate held steady at 3.1%, up slightly from the May-June low of 3.0%, and still was nearly the lowest in the series' short eight year history.The hires rate is the number of hires during the month divided by employment.The actual number of hires also was off its low but was still down by 11.0% year-to-year. Factory sector hiring recently has picked up slightly but remains off 14.1% y/y while construction sector hiring has moved sideways since the winter (-3.3% y/y). Leisure & hospitality industry jobs fell 6.0% to a new series' low (19.8%) as did retail sector hiring (-19.1%). In the professional & business services industry hires slipped after two strong monthly gains (-11.2% y/y) while jobs in the education & health services jobs gave back the July increase but remained up 3.6% y/y.
 The job separations rate remained at the
series' low of 3.3% with the actual number of separations off 11.2%
year-to-year. Separations include quits, layoffs, discharges,
and other separations as well as retirements.
The job separations rate remained at the
series' low of 3.3% with the actual number of separations off 11.2%
year-to-year. Separations include quits, layoffs, discharges,
and other separations as well as retirements.
The JOLTS survey dates only to December 2000 but has followed the movement in nonfarm payrolls, though the actual correlation between the two series is low.
A description of the Jolts survey and the latest release from the U.S. Department of Labor is available here and the figures are available in Haver's USECON database.
| JOLTS (Job Openings & Labor Turnover Survey) | September | August | Sept. '08 | 2008 | 2007 | 2006 |
|---|---|---|---|---|---|---|
| Job Openings, Total | ||||||
| Rate (%) | 1.9 | 1.8 | 2.4 | 2.3 | 3.1 | 3.3 |
| Total (000s) | 2,480 | 2,423 | 3,346 | 3,224 | 4,382 | 4,606 |
| Hires, Total | ||||||
| Rate (%) | 3.1 | 3.1 | 3.3 | 41.1 | 46.1 | 47.6 |
| Total (000s) | 4,010 | 4,040 | 4,505 | 56,486 | 63,666 | 64,879 |
by Robert Brusca November 11, 2009
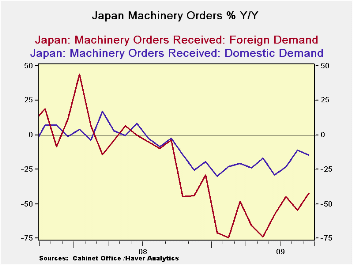
Japan’s machinery orders rose by 6% in September. Core machinery orders spurted by 10.5%. Foreign demand is the whole of the pickup as domestic orders fell by 5.4% while foreign orders rose by 25.9% both in September.
The three month metrics show that core orders are still not out of the woods; their three month growth rate is just 2.9% annualized the same as their six month growth rate. Still these two horizon growth rates are better than the -21.8% Year-over-year performance. Core machinery orders are no longer falling but they are not rising very rapidly.
The same sort of shortfalls exist across countries
Moreover Japan like Germany is benefiting from external growth. Over three months, foreign demand is up at a 180% annual rate that is an acceleration from a 60.4% annual rate over six months and those numbers reverse the 42% drop in foreign demand Yr/Yr. Still, domestic demand is wanting. Over three months it is up at a 19.9% pace, better than the -1% rate over six months, and that is an improvement from the drop of 14.9% Yr/Yr.
On balance Japan’s orders are on the mend. Even domestic
orders are showing a push into positive territory. But these series are
very volatile and given the volatility the recent domestic growth
figures are not very impressive. Much more impressive is the growth in
foreign orders that seems to be jumpstarting Japan as a whole.
As the global economy turns to recovery one key challenge is going to be to see if surplus and deficit countries begin to make adjustments. Note that Japan and Germany, traditional exporting powers, continue to get a lot of their stimulus from overseas. China’s trade surplus was up this month. How is the US going to keep the lid on its deficit if everyone else is running surpluses? Large structural trade imbalances and the persisting investment flows they imply was one of the main sources of instability in this past cycle. Is anything going to change?
| Japan Machinery Orders | |||||||
|---|---|---|---|---|---|---|---|
| m/m % | Saar % | ||||||
| SA | Sep-09 | Aug-09 | Jul-09 | 3-Mos | 6-Mos | 12-Mos | 12-Mo Ago |
| Total | 6.0% | -1.9% | 7.5% | 56.1% | 2.6% | -26.5% | -2.5% |
| Core Orders* | 10.5% | 0.5% | -9.3% | 2.9% | 2.8% | -21.8% | -3.7% |
| Total Orders | |||||||
| Foreign Demand | 25.9% | -15.7% | 21.8% | 180.0% | 60.4% | -42.2% | -3.5% |
| Domestic demand | -5.4% | 7.1% | 3.4% | 19.9% | -1.0% | -14.9% | -2.8% |
| * Excl ships and electric power | |||||||

Tom Moeller
AuthorMore in Author Profile »Prior to joining Haver Analytics in 2000, Mr. Moeller worked as the Economist at Chancellor Capital Management from 1985 to 1999. There, he developed comprehensive economic forecasts and interpreted economic data for equity and fixed income portfolio managers. Also at Chancellor, Mr. Moeller worked as an equity analyst and was responsible for researching and rating companies in the economically sensitive automobile and housing industries for investment in Chancellor’s equity portfolio. Prior to joining Chancellor, Mr. Moeller was an Economist at Citibank from 1979 to 1984. He also analyzed pricing behavior in the metals industry for the Council on Wage and Price Stability in Washington, D.C. In 1999, Mr. Moeller received the award for most accurate forecast from the Forecasters' Club of New York. From 1990 to 1992 he was President of the New York Association for Business Economists. Mr. Moeller earned an M.B.A. in Finance from Fordham University, where he graduated in 1987. He holds a Bachelor of Arts in Economics from George Washington University.
More Economy in Brief


