 Global| Jun 28 2011
Valuing Stock Markets: The Equitization Ratio A Variation of Tobin's Q
Summary
The Equitization Ratio, the ratio of the market capitalization of a country to its gross domestic product has become a popular measure of stock market valuations. Warren Buffet is quoted as saying "this ratio is probably the best [...]
 The Equitization Ratio, the ratio of the market capitalization of a country to its gross
domestic product has become a popular measure of stock market valuations. Warren Buffet is
quoted as saying "this ratio is probably the best single measure of where valuations stand at any given time."
The ratio is reminiscent of Tobin's "Q". Back in 1969, James Tobin, Nobel Laureate
in Economics, used the ratio, which he called "Q", of the market value of equities to the replacement
cost of assets as a measure of stock market valuation. Tobin's Q can be approximated for the United
States, using balance sheet data for non farm non financial corporate business in the Federal Reserve's Flow of Fund data.
Data are available there for the market value of equities replacement cost of net worth and the ratio of the two.
Data to compute Tobin's Q for most other countries, particularly emerging countries, are not available.
As a result, many economists have begun to use the ratio of the stock market capitalization to
GDP as an approximation for Tobin's Q.
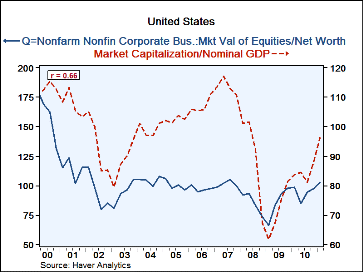
Just how good an approximation it is can be seen in the first chart, which shows Q and the Equitization
ratio for the United States. The equitization ratio tends to be higher than the Q ratio, but there is a fairly
good correlation between the two ratios, indicating that the two series follow similar trends.
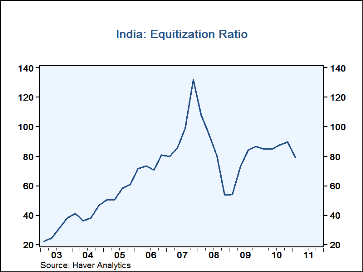
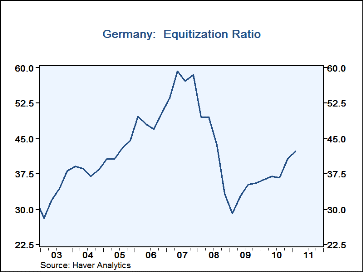
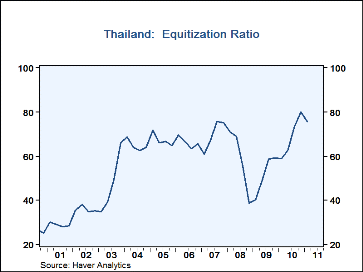
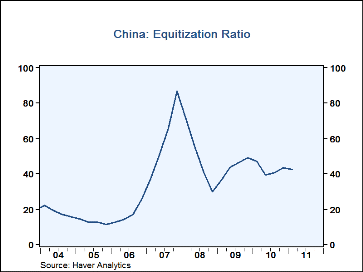
The equitization ratio can be calculated using Haver data bases. Market capitalizations are found in EQUITIES and Nominal GDPs for most countries can be found in either EMERGE or G10. We calculated the equitization ratios for Germany, India, Thailand and China, which are shown in the second, third, four and fifth charts and that for the U.S. is shown in the first chart as noted above.
A country's equitization ratio is determined by institutional arrangements peculiar to that country; as a result, comparisons among countries are not meaningful. The equitization ratios for the United States and Germany are respectively 98.5 and 42.1. This does not mean that stock market valuations are almost twice as high in the U.S. as they are in Germany. However, the deviation of the current ratios for the U. S. and Germany from their means gives some idea of the relative over or under valuation of the two stock markets. Germany seems to be very slightly undervalued with its mean 1.9 points below its mean, while the U. S. seems to be very slightly overvalued at 1.2 points above its mean. Of the three emerging markets we have selected, Thailand appears to be the most overvalued at 23.1 points above its mean, India next at 16.0 points above its mean and China, third at 9.7 points above its mean.
Incidentally, I wonder if more use of the equitization ratio might result in a more euphonious name. The Modified Q Ratio perhaps?
| Equitization Ratio | 2007 Peak | 2009 Low | Q1 2011 | % Decline | % Rise | Mean | Curr Less Mean |
|---|---|---|---|---|---|---|---|
| United States | 118.5 | 56.5 | 98.5 | -52.3 | 74.3 | 97.3 | 1.2 |
| Germany | 59.7 | 28.6 | 42.1 | -52.1 | 47.2 | 44.0 | -1.9 |
| India | 142.5 | 55.9 | 81.9 | -60.6 | 46.5 | 65.9 | 16.0 |
| Thailand | 76.2 | 40.0 | 79.2 | -47.5 | 98.0 | 55.1 | 24.1 |
| China | 95.0 | 30.4 | 43.5 | -68.0 | 43.1 | 33.8 | 9.7 |


