 Global| Sep 15 2009
US Retail Sales Make StrongGains...
Summary
US retail sales rang up strong results in August. The cash for clunkers program aided auto sales to a greater extent that most economists had anticipated. Sales rose by 2.7% month-over-month boosted by vehicle sales which rose by [...]
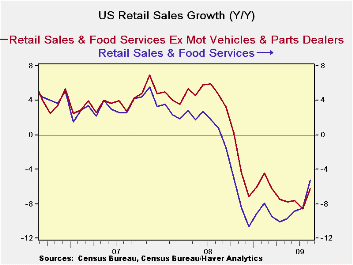
US retail sales rang up strong results in August. The cash for
clunkers program aided auto sales to a greater extent that most
economists had anticipated. Sales rose by 2.7% month-over-month boosted
by vehicle sales which rose by 10.7% on the month. Most major
categories of sales rose in the month; furniture and electronics was a
minor exception dropping by 0.1% and building materials was a major
exception falling by an outsized 1.2% on the month. Stripping out
gasoline stations where sales rose 5.1% mostly on higher prices and
removing motor vehicles as well left retail sales up by 0.6% on the
month. That particular sub-group exhibits improving sequential growth
rates as well.
Year-over-year sales declines are still severe and that is a
legacy of the severity of the recession and its impact on the consumer.
Over 7miln jobs have been lost in the business cycle and that is a huge
loss of income and of spending power for those consumers. But while the
Yr/Yr drops are severe there are also some distortions. Nondurable
goods sales excluding gas stations are down by only 0.9% Yr./Yr.
Durables spending is down by 5.8% Yr/Yr on large declines in building
materials and in furniture. The boost to vehicle sales this month
leaves them lower Yr/Yr by just 1%.
The messages from this report are that the consumer sector has
been hit hard by recession. Cash for clunkers has boosted auto’s up
form weakness overall and has given those sales a huge boost in the
month- a boost that is likely not sustainable – that’s the bad news
looking ahead. Still, the August results leave sales in the new quarter
(Q3) expanding at an annual rate of 9.5%. Extracting the vehicle
component that growth rate comes down to 2.7%. Ex food and energy sales
are up at a pace of 8.5% in Q3 and estimating the inflation impact
leaves real core sales up at a pace of nearly 7% at an annual rate in
Q3 compared to Q2. This is the compounded growth rate for Q3, two
months into the quarter. But a drop off in auto sales is likely to trim
this impact of quarterly consumer spending on retail sales by the time
the quarter’s final numbers are in.
While it is good news for August and it the best news may be
that sales have spread beyond autos, and have done so without a
government help plan. The real question is how far will auto sales fall
when the cash for clunkers program ends? There will be a spillover of
some sales into September but Q4 will have to do what it can without
any boost from this special program. All that raises some questions
about the future, despite some nice improving fundamentals for the
economy. The downside of government support programs is that those
programs one day end… a second downside factor is that somebody has to
pay for them.
| Retail Sales Trends | |||||
|---|---|---|---|---|---|
| Mo/Mo | Seasonally Adjusted Annual Rate | ||||
| Retail Aggregates | 2009.Aug | 3-Mo | 6Mo | Yr/Yr | YrAgo:Y/Y |
| Retail & Food Service | 2.7% | 14.3% | 4.7% | -5.3% | 0.8% |
| Retail Excl MV&Parts | 1.1% | 5.1% | 0.1% | -6.2% | 4.7% |
| Retail Excl MV&Parts&Gas | 0.6% | 1.0% | -2.3% | -2.9% | 2.5% |
| Durables | 2009.Aug | 3-Mo | 6Mo | Yr/Yr | YrAgo:Y/Y |
| Totals | 5.9% | 32.1% | 10.8% | -5.8% | -10.1% |
| Building Materials | -1.2% | -13.6% | -9.5% | -13.6% | -2.0% |
| Motor Vehicles & Parts | 10.6% | 70.3% | 29.5% | -1.0% | -14.4% |
| MV Dealers | 11.9% | 83.3% | 35.0% | -0.8% | -15.9% |
| Furniture,electonics,etc | -0.2% | -4.5% | -15.9% | -11.6% | -5.0% |
| NonDurables | 2009.Aug | 3-Mo | 6Mo | Yr/Yr | YrAgo:Y/Y |
| Totals | 1.4% | 7.8% | 2.3% | -5.1% | 6.2% |
| Food&Bev | 0.5% | 0.9% | 1.9% | -1.1% | 6.8% |
| Health | 0.4% | 1.3% | 2.3% | 2.9% | 3.2% |
| Gasoline | 5.1% | 47.4% | 24.5% | -26.7% | 20.6% |
| Clothing | 2.4% | 1.2% | -4.8% | -5.1% | 0.6% |
| SportGoods | 2.3% | 12.8% | 0.4% | -0.4% | 0.6% |
| GenlMerch | 1.6% | 5.0% | -1.9% | -0.7% | 3.7% |
| NonStore Retailers | 0.1% | 9.7% | 2.5% | -2.6% | 4.0% |
| Misc Retail | 0.2% | 1.3% | 2.3% | 2.9% | 3.2% |
| NonDurables EXCL Gas | 0.8% | 3.2% | -0.4% | -0.9% | 3.8% |
| Services | |||||
| Food Service & Drinking | 0.3% | -0.5% | -1.7% | 0.7% | 3.7% |
Optimism Among German Investors Somewhat Subdued
by Louise Curley September 15, 2009
In the September ZEW survey, released today, German analysts
and institutional investors were only slightly more optimistic about
the next six months than they were in August. The ZEW balance of
optimists over pessimists rose only 1.2 percentage points from 56.1% to
57.7%. The views of the financial community tend to be considerably
more volatile than the views of those engaged in industry, trade and
services. The latter represented in the IFO measure of German economic
opinion, were still showing an excess of pessimism regarding
the outlook for the next six months of 7.7% in August. The two measures
are shown in the first chart. The correlation between the two series is
only .41 suggesting that the two groups frequently differ as to the
outlook.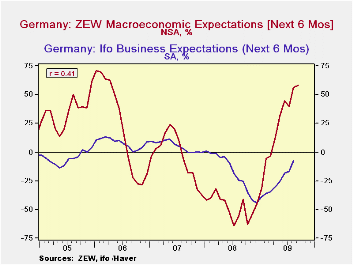
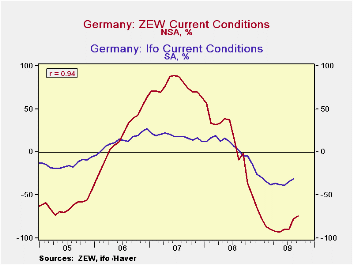
The German investors were also subdued in appraising the current situation. The excess of pessimists regarding the current situation declined only 3.2 percentage points to 74.0 from 77.2 in August. Again, the views of the financial community are more volatile than those of the participants in the IFO survey. The excess of pessimists among the latter was only 31% in August. In contrast to their often divergent views on the outlook the two communities tend to view the current outlook similarly. In spite of the greater volatility, the views of the financial community move in the same direction as that of the business community, as attested by the high degree of correlation--.94--between the two series shown in the second chart.
According to the President of ZEW, Prof, Dr. Dr. h.c. mult. Wolfgang Franz, "The economic expectations for Germany are consistent with the picture that the Germany economy is recovering, but at a slow pace."
| Sep 09 | Aug 09 | Sep 08 | M/M | Y/Y | 2008 | 2007 | 2006 | |
|---|---|---|---|---|---|---|---|---|
| ZEW % balance | ||||||||
| Current Conditions | -74.0 | -77.2 | -1.0 | 3.2 | -73.0 | 7.3 | 75.9 | 18.3 |
| Expectations for Economy 6 mos ahead | 57.7 | 56.1 | -1.0 | 1.6 | 98.8 | -47.5 | -3.0 | 22.3 |
| IFO % balance | ||||||||
| Current Conditions | n.a. | -31.0 | -- | n.a. | n.a. | 4.0 | 18.1 | 12.7 |
| Expectations 6 mos ahead | n.a. | -7.7 | -- | n.a. | n.a. | -17.4 | 5.2 | 7.9 |
PPI Headline Spurts As Core Is Stable
by Robert Brusca September 15, 2009
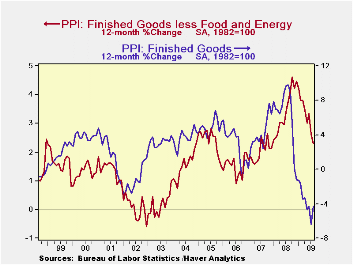
The PPI headline spurted by 1.7% in August as the core rose by
02% and core for consumer prices at the producer level edged up by just
0.1%. Finished energy prices rose by 8% in the month. The headline
displays an accelerating pattern of growth rates for 12-month to
6-month to 3-month rates of inflation. But the core pattern has been
more settled and core pattern for consumer prices at the producer level
has been even more tranquil.
We learned from the last time energy prices spiked in the
recession that a transmission of their gains to the core was not
automatic. Rising energy prices have both inflationary and deflationary
effects. When consumers and firms do not have the power to bargain for
wage and price hikes, as is the case now, it is more likely that rising
energy prices impact growth adversely instead of impacting inflation
positively.
Still what we are seeing here are volatile price movements.
Energy prices have had a standard deviation of 5 percentage points on
the month to month percentage changes since the recession began. That
kind of volatility tends to impart considerable uncertainty into the
headline PPI each month.
The 8% m/m rise in energy prices in August is the largest
since a 10.2% gain in November 2007. Energy prices are up in four of
the last five months and in six of the last eight months. Prior to that
energy prices had fallen for five months in a row.
Spot oil prices on world markets, however, have been hovering
around the $70/bbl mark for a number of months. Oil prices have been
playing catch up since the recession has come off its worst of times
and oil prices have bounced and are trying and find a new higher
equilibrium.
For now the core PPI price patterns are reassuring. Since
global oil price trends are not running away we can look for the energy
market in the US to find a level that is consistent with global prices
and for the energy component of the PPI to settle down. It does not
look very inflationary now in this economy but we are looking for
recovery to set in. As that happens the risk will multiply and the
potential for inflation to take root will improve somewhat. I am no
inflation monger. But circumstance will change. For now inflation is
not the worry, it’s just a bad monthly result in the least important of
all US inflation reports.
Long live the CPI and the PCE deflator where trends are more important. In that regard the tranquil inflation embedded in core consumer prices at the producer prices level is reassuring.
| Key Trends In Producer Prices | |||||
|---|---|---|---|---|---|
| Aug-09 | PPI Trends By Type Of Good | ||||
| PPI | 1Mo:M/M | 3-Mo:ar | 6-Mo:ar | 1-Yr | Yr-Ago |
| Total PPI | 1.7% | 11.0% | 4.3% | -4.3% | 9.8% |
| Finished Consumer Gds | 2.3% | 14.4% | 5.5% | -5.9% | 11.7% |
| Consumer Foods | 0.4% | 0.0% | -1.7% | -3.9% | 9.1% |
| Finished C Gds Excl Foods | 2.9% | 19.5% | 8.1% | -7.0% | 12.7% |
| Nondurables less Food | 3.9% | 26.6% | 10.4% | -10.4% | 16.6% |
| ConsNonDurxF&E | 0.0% | 1.9% | 2.0% | 3.0% | 5.4% |
| Durable Goods | 0.3% | 2.8% | 2.1% | 2.5% | 2.2% |
| Finished Core Cons Gds | 0.1% | 2.2% | 2.0% | 2.8% | 4.0% |
| Capital Goods | 0.3% | 2.3% | 0.6% | 1.8% | 3.3% |
| MFG Industries | 0.1% | 0.8% | 0.3% | 0.6% | 3.9% |
| NonMFG Industries | 0.3% | 2.9% | 0.8% | 2.2% | 3.1% |
| Core PPI | 0.2% | 2.4% | 1.4% | 2.3% | 3.8% |
| Memo: Finished Energy | 8.0% | 59.6% | 19.8% | -21.3% | 27.9% |
Sales Trim Losses As Inventories Are Looking Lean
by Robert Brusca September 15, 2009
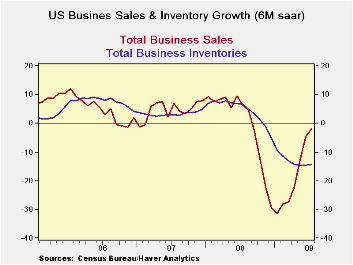
Inventories fell again in the current month. Still the 1% drop
while large is the smallest drop in eight months. Inventories average a
1.3% monthly decline in Q2 so in Q4 inventories are improving by 30%
over the previous quarter.
The inventory conundrum - For the impact
on GDP, it is not the change in inventory levels that matters but the
change in the change. If inventories fall by the same amount in each
month of Q2 and in Q3 the change in inventory investment will be zero
(the same amount of investment in each quarter). The fact that
inventories are falling by less in Q3 is the key to seeing there is a
boost in GDP in the offing even though inventories are still falling.
Right now the average drop per month in Q3 is $13bln compared to a drop
of $18bln in Q2. Annualize that difference and you get a large swing.
Still you still have to inflation-adjust those numbers and remember, it
is only one month in the new quarter. But you get the picture.
Inventories are a positive factor already.
I to S ratio is LOW - In the table above we
show the percentile standing of the I-to-S ratio in its three-year
range. For retailers it is the lowest inventory-to-sales ratio in three
years. Wholesalers have inventories at a mid range mark, while for
manufacturers inventories are still in the top 22% of their three year
range (78th percentile) relative to sales.
Sequential growth trend is your friend--
The sequential growth rates show that the pace of sales has moved from
the negative to the positive from 12-months to six-months to 3-months
across manufacturers, retailers and wholesalers. This is good news. The
pace of inventory declines for the most part seems to have plateaued as
three month growth rates are even with six month growth rates for the
major business sectors.
The end of days…the dog days -- Despite the fact that inventories are still declining you cans see the whites of the business expansion’s eyes. The end of recession is at hand; the start of recovery is in play. Sales are on an upswing across sectors the I-to-S ratios are mostly low and the pace of the inventory decline is flattening out. These facts should make inventories a positive factor for growth in Q3 and could make them a powerful factor for Q4 growth as well. Remember that inventories are still falling and the rebuilding process has not yet begun, so this switch powered eventually by inventory growth, not just slower paring, could go on for some time.
| 2009.Jul | Inventory and Sales Paired Growth Rates by Major Divisions | ||||||||
|---|---|---|---|---|---|---|---|---|---|
| 3-Mo Growth |
6-Mo Growth |
12-Mo Growth |
YrAgo Growth |
I:S ratio |
|||||
| Sales | Inventory | Sales | Inventory | Sales | Inventory | Sales | Inventory | %-tile | |
| Total Business | 4.7% | -13.6% | -1.9% | -14.2% | -17.8% | -11.8% | 7.9% | 6.7% | 52.4% |
| Manufacturers | 3.8% | -10.0% | -3.6% | -11.8% | -22.2% | -10.0% | 7.1% | 7.8% | 78.6% |
| Retailers | 5.5% | -14.6% | 0.2% | -13.9% | -9.5% | -12.9% | 1.5% | 2.2% | 0.0% |
| Wholesalers | 5.0% | -17.0% | -2.0% | -17.4% | -19.8% | -12.8% | 15.2% | 11.0% | 52.2% |
| Ratio of STOCKS to Sales; Stocks Vs Flows | |||||||||
| Inventory-to-Sales Ratios In Perspective | Over three Years | ||||||||
| 2009.Jul | Current | 3Mo Ago |
6Mo Ago |
Yr Ago |
2Yrs Ago |
3Yrs Ago |
%-tile | Max | Min |
| Total Business | 1.36 | 1.43 | 1.46 | 1.27 | 1.28 | 1.28 | 52.4% | 1.46 | 1.25 |
| Manufacturers | 1.40 | 1.45 | 1.46 | 1.21 | 1.20 | 1.19 | 78.6% | 1.46 | 1.18 |
| Retailers | 1.45 | 1.53 | 1.57 | 1.51 | 1.50 | 1.50 | 0.0% | 1.62 | 1.45 |
| Wholesalers | 1.23 | 1.31 | 1.34 | 1.13 | 1.17 | 1.17 | 52.2% | 1.34 | 1.11 |

Robert Brusca
AuthorMore in Author Profile »Robert A. Brusca is Chief Economist of Fact and Opinion Economics, a consulting firm he founded in Manhattan. He has been an economist on Wall Street for over 25 years. He has visited central banking and large institutional clients in over 30 countries in his career as an economist. Mr. Brusca was a Divisional Research Chief at the Federal Reserve Bank of NY (Chief of the International Financial markets Division), a Fed Watcher at Irving Trust and Chief Economist at Nikko Securities International. He is widely quoted and appears in various media. Mr. Brusca holds an MA and Ph.D. in economics from Michigan State University and a BA in Economics from the University of Michigan. His research pursues his strong interests in non aligned policy economics as well as international economics. FAO Economics’ research targets investors to assist them in making better investment decisions in stocks, bonds and in a variety of international assets. The company does not manage money and has no conflicts in giving economic advice.
More Economy in Brief


