 Global| Jan 28 2008
US New Home Sales Off 41% in Last Twelve Months; Lowest Since 1995
by:Tom Moeller
|in:Economy in Brief
Summary
At the end of 2007, new single family home sales dropped 4.7% to 604,000 after falling 12.6% m/m during November. A sales rate of 649,000 was the Consensus expectation for last month. The full year, however, contained much worse news. [...]
At the end of 2007, new single family home sales dropped 4.7% to 604,000 after falling 12.6% m/m during November. A sales rate of 649,000 was the Consensus expectation for last month. The full year, however, contained much worse news. New home sales during the twelve months of 2007 fell 40.7%. Since the monthly peak in July of 2005 the decline in sales to December totaled 56.5% and the latest was the lowest level since 1995.
For the full year new home sales plunged a record 26.3% from 2006. That decline followed an 18.6% drop in '06. Together, the 39.5% drop during 2006-07 just edged out the 1980-81 shortfall of 38.1%.
Sales in the Northeast rose a modest 6.0% (-27.4% y/y) last month and it was the fourth increase in the last five months. A bottom seemed to form as sales for the full year ticked down just 0.8% after a 22.1% downdraft during 2006. Sales in the Midwest conversely, plunged to a new low in the last two months of 2007. A 1.2% December drop came on the heels of a 37.7% plunge during November.
December sales in the South also searched out a new low with
the ninth decline for the year, down 6.5% m/m. December to December
sales in the South were off by more than one third and were down 52.7%
from the 2005 peak. Sales out West, however, were the weakest of the
country's regions with no bottom yet in view. The 6.0% m/m decline in
December lowered sales from December 2006 by 42.9% and for the full
year sales were off by one-third. The latest level of sales was down
67.7% from the monthly peak set during July of 2005.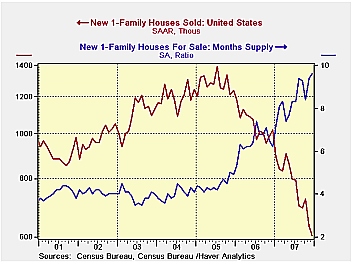
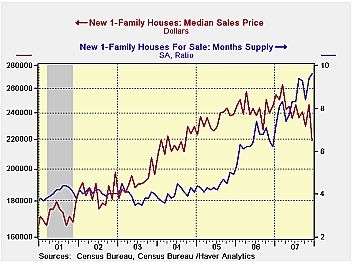
Sales declines did nothing for prices in 2007. For December a 10.9% decline more than reversed a 7.1% November rise. The downdraft left prices off 10.4% December to December and down 16.5% from the peak earlier this year.
The inventory of new homes for sale continued down as housing starts apparently fell more than sales. Homes for sale fell another 1.4% last month and the supply of homes is off 7.5% since December of 2006. The inventory of unsold homes is down most everywhere but the 20% decline in the Midwest is the largest of the four regions.
The decline in the number of homes for sale has not, however, kept up with the drop in home sales. At the current low sales rate, the 9.6 months' supply of homes on the market was more than double the rate for all of 2005 and it was the highest since 1981.
Rising Foreclosures in the United States: A Perfect
Storm from the Federal Reserve Bank of Kansas City is
available
here.
| US New Homes | December | November | Y/Y | 2007 | 2006 | 2005 |
|---|---|---|---|---|---|---|
| Total Sales (SAAR, 000s) | 604 | 634 | -40.7% | 773 | 1,049 | 1,279 |
| Median Price (NSA, $) | 219,200 | 245,900 | -10.4% | 242,383 | 243,067 | 234,208 |
by Robert Brusca January 28, 2008
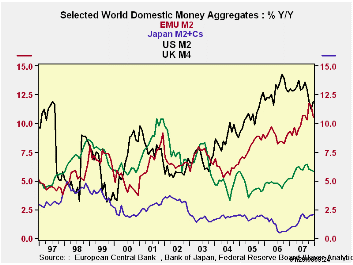
On the face of it money supply growth should not give us much
cause to fear recession. The US and UK show slowdowns in high frequency
growth rates of money supply but only the US three-month rate is a
negative one; and three-month growth rates are often more volatile than
indicative. Japan’s pace of money growth is mostly steady at a low
rate. Money growth rates do not seem to be a place to find a reason to
fear an economic recession either in the US or in Europe.
The Euro area. The Euro area is posting huge growth
rates in money and key credit aggregates; those growth rates remain
bloated even when deflated by the headline HICP. EMU loan growth slowed
over the past year compared to the past three years' average;
inflation-adjusted, the slowing is more pronounced from near 12% to
7.5% over the past year and to 2.7% over the last three months
annualized. Residential real credit slowed from its three-year pace but
has not slowed over two years when its growth has remained too-strong
just short of 13%. Inflation-adjusted, there has been a bit more
slowing in residential credit but not much. The three-month growth rate
in fact tells us that for residential borrowers there has been little
retraction in Euro credit at all. The overall pace for loans has slowed
from its three-year pace but the two-yea and one-year rates of growth
are still steady and high. The three-month nominal pace has slowed to
around 8% from near 11% but the real slowing is in the
inflation-adjusted figures. There, loan growth is seen down from 11.9%
over three years to 5.3% over two years back up to 7.5% over the past
year then with a sharper slowing over six months and three months to a
low three-month rate of 2.7%. This slowdown in overall credit suggests
that there is some slowing in credit outside the residential sector in
Europe. Still the 3-month growth rate in credit above the rate of
inflation is substantial. It does not seem to be the sort of thing to
bring on recession. But the downward shift in the rate of growth in
real credit may be indicating a slowing in growth.
The US. In the US nominal money growth slowed over
two-year and one-year horizons compared to three years but has seen
otherwise quite stable growth rates at around 5.5%. Real balances have
slowed much more and are registering negative growth over three months.
US real GDP growth has been outstripping what money supply would have
allowed in the US with constant money velocity. If velocity fails to
expand (velocity is the inverse of the money to GDP ratio) the economy
does seem set for a slowing. The recent negative real money growth rate
is mild warning, but it is only a three-month figure and so is
indicative, not demonstrative. The year/year growth of real balances at
1.7% is appropriate for a period when headline inflation has overshot
and oil prices have threatened to extend inflation’s push into the core
rate of inflation. ‘Money supply policy’ or at least the result seems
broadly in line.
The UK. In the UK money supply nominal and real
slowdowns are like those in the US only more severe. The rate of money
growth in the UK remains higher than in the US but the deceleration is
sharper and may be more of a factor in adversely affecting growth there
in the short run.
Japan. Japan’s money growth has been low and steady.
After inflation adjustment real money balances are lower but are just
skimming above the unchanged level.
Summing up. On balance, Central banks seem to been
relatively reserved during this period when oil prices have flared. The
ECB makes pointed references to money supply and credit in its policy
deliberations and it has been uncomfortable with what it has been
seeing for some time. The BoE and BoJ also use monetary references. The
Fed makes policy without much reference at all to money supply and has
even abolished a monetary aggregate (M3) in recent years. While
financial market innovations may have made it harder to measure what
economists mean by ‘money’ the monetary definitions offered up by
central banks are for the most part growing and do not look to have
created much in the way of special growth problems for the recent
quarters. Japan continues with low but stable real balance growth and
nominal money growth. The UK has the largest deceleration in money
growth rates. The US has a three-month shift to a negative real balance
growth rate, too short a period to be taken as definitive on
illiquidity. The ECB’s aggregates remain above its tolerance levels as
does its inflation rate. But the squeeze in Europe, if there is one, is
on businesses not on households or the consumer.
| Look at Global and Euro Liquidity Trends | |||||||
|---|---|---|---|---|---|---|---|
| Saar-all | Euro Measures (E13): Money & Credit | G-10 Major Markets: Money | Memo | ||||
| €€ M2Supply | Credit: Residential |
Loans | $US M2 | ££UK M4 | ¥¥Japan M2+CDs |
OIL: WTI | |
| 3-Mos | 11.3% | 13.7% | 8.2% | 5.3% | 7.0% | 2.6% | 77.5% |
| 6-Mos | 11.1% | 12.8% | 10.0% | 5.6% | 10.6% | 1.4% | 84.8% |
| 12-Mos | 10.6% | 12.8% | 10.8% | 5.9% | 11.9% | 2.0% | 46.8% |
| 2-Year | 6.5% | 12.2% | 10.7% | 5.5% | 12.3% | 1.4% | 24.2% |
| 3-Year | 14.7% | 17.6% | 16.0% | 7.7% | 19.2% | 2.3% | 45.1% |
| Real Balances deflated by Own CPI. Oil deflated by US CPI | |||||||
| 3-Mos | 5.6% | 7.9% | 2.7% | -0.3% | 2.2% | 0.2% | 68.0% |
| 6-Mos | 7.3% | 8.9% | 6.2% | 2.2% | 8.3% | 0.0% | 79.0% |
| 12-Mos | 7.3% | 9.5% | 7.5% | 1.7% | 9.6% | 1.3% | 41.0% |
| 2-Year | 4.8% | 6.2% | 5.3% | 1.4% | 6.3% | 0.6% | 13.0% |
| 3-Year | 10.7% | 13.5% | 11.9% | 2.5% | 15.2% | 2.2% | 38.1% |
by Louise Curley January 28, 2008
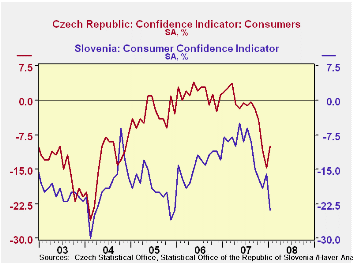
Confidence indicators for the Czech Republic and Slovenia were published today. They give a mixed picture. Consumer confidence was up in the Czech Republic and down in Slovenia; confidence in industry was down slightly in the Czech Republic while confidence in manufacturing was unchanged in Slovenia.
Over the last five years consumers in Slovenia have had little confidence in the economic outlook. Pessimist have outweighed optimists over the whole period. In the latest survey in January pessimists outweighed optimists by 24%, the third largest excess of pessimists in the whole period. While consumers in the Czech Republic have not exactly been brimming with confidence, from mid 2005 to early 2007, there were frequent periods when the optimists exceeded pessimists if only by a small margin. Beginning in April of last year, however, the pessimists began to exceed the optimists rising to an excess of 14.6% in December. In the latest survey, the excess of pessimists has dropped to 9.9%. Consumer confidence in Slovenia and the Czech Republic are shown in the first chart.
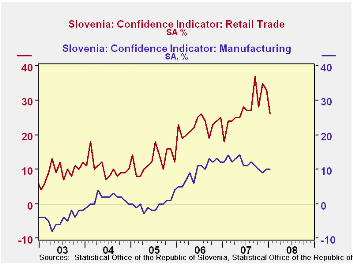
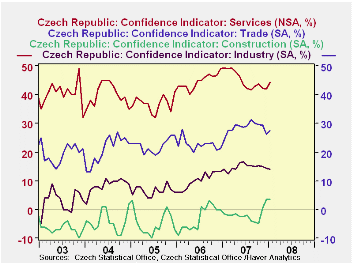
In the business community, the optimists have generally outweighed the pessimists by a small margin over the last five years. The survey of business opinions is broader in the Czech Republic and than in Slovenia. In Slovenia, only businesses engaged in manufacturing and retail trade are canvassed, while in the Czech Republic, industry, construction, trade and services are canvassed. In both countries it has been the more positive outlook for trade that has accounted for the overall optimism of business. In January, the excess of optimists over pessimists in trade rose by 1 percentage point in the Czech Republic, but although it fell 7 percentage points in Slovenia. It was 8 percentage points above January, 2007. In the case of the Czech Republic, the prevailing optimism in the service businesses has also added to the overall optimism while the prevailing pessimism in the construction industry has subtracted from it. The second and third charts show the business confidence indicators for the two countries.
| MEASURES
OF CONFIDENCE (Percent Balance) |
Jan 2008 | Dec 2007 | Jan 2007 | M/M Dif | Y/Y Dif | 2006 | 2005 | 2004 |
|---|---|---|---|---|---|---|---|---|
| BUSINESS | ||||||||
| Czech Republic (Industry) | 14.0 | 14.3 | 17.0 | -0.3 | 0.0 | 14.8 | 10.2 | 6.5 |
| Slovenia (Manufacturing) | 10 | 10 | 12 | 0 | -2 | 12 | 10 | -0 |
| CONSUMER | ||||||||
| Czech Republic | 9.9 | 14.9 | 1.9 | 4.5 | -11.8 | -2.3 | 1.4 | -2.9 |
| Slovenia | -24 | -16 | -8 | -8 | -16 | -11 | -14 | -19 |
| CZECH REPUBLIC | ||||||||
| Construction | 3.5 | 3.5 | -1.5 | 0.0 | 5.0 | -2.0 | -2.9 | -4.8 |
| Trade | 27.3 | 26.2 | 24.3 | 1.0 | 3.0 | 28.6 | 22.6 | 22.3 |
| Services | 44.3 | 42.0 | 49.3 | 2.3 | -5.0 | 45.0 | 44.7 | 36.8 |
| SLOVENIA | ||||||||
| Retail Trade | 26 | 33 | 18 | -7 | 8 | 28 | 23 | 12 |

Tom Moeller
AuthorMore in Author Profile »Prior to joining Haver Analytics in 2000, Mr. Moeller worked as the Economist at Chancellor Capital Management from 1985 to 1999. There, he developed comprehensive economic forecasts and interpreted economic data for equity and fixed income portfolio managers. Also at Chancellor, Mr. Moeller worked as an equity analyst and was responsible for researching and rating companies in the economically sensitive automobile and housing industries for investment in Chancellor’s equity portfolio. Prior to joining Chancellor, Mr. Moeller was an Economist at Citibank from 1979 to 1984. He also analyzed pricing behavior in the metals industry for the Council on Wage and Price Stability in Washington, D.C. In 1999, Mr. Moeller received the award for most accurate forecast from the Forecasters' Club of New York. From 1990 to 1992 he was President of the New York Association for Business Economists. Mr. Moeller earned an M.B.A. in Finance from Fordham University, where he graduated in 1987. He holds a Bachelor of Arts in Economics from George Washington University.
More Economy in Brief


